The gang and I made our first QSO with Australia this week!
The QSO came bundled with two other DX contacts made with Project TouCans—all in a 16 minute window—which I'll write about soon. Our camping site is nestled below Anvil Mountain to the East and across the Million Dollar Highway from South Mineral Springs, about two miles north of Silverton, CO. We're surrounded by peaks on all sides. Bear Mountain peak is framed in my pictures of the rig.
Project TouCans was probably 20 feet up in its dipole. This turned out to be difficult to show in photographs with the proper perspective. I finally decided to make a gif of different zoom levels of a single photo. The picture below starts out focused on Bear Mountain Peak and then zooms out to include the rig and the ground outside my partner's and my tent.
You can see the Bluetooth transmitter that brings the head phone audio down to the ground hanging from the bottom of the rig.
The campsite is gorgeous and almost completely bug free. I managed to make it out on one hike. Tawnse—the nine year-old—our puppy, and I were treated to views like this
Notice the mountains lurking very nearby in every shot.
That brings us to the circumstances of the QSO with VK3YV, the first DX QSO of that morning. Here's our campsite from a way's out showing the F2 skip path (estimated using real-time data from the Boulder, CO ionosonde), as well as the path of the QSO along the ground.
Zooming in a bit reveals just how many peaks we were surrounded by and shows our location relative to Silverton.
So, with all those mountains in the way, how did we talk to Australia?
Project TouCans threaded the valley to the west of our campsite! Check this out!
I'll leave you with the map of the QSO so you can trace along the path at your leisure. Use the time control in the lower left corner or the slider along the bottom of the map to locate the QSO at 12:40 UTC. From there, you can zoom in and out using a mouse center-button wheel. You can also tilt by holding down the control key, and then moving the map using the left mouse button.
Update
Due to a bug in the ionosonde code that I'd immediately introduced, the F2 layer height was not 307 km as shown in the diagram above. It was in fact, 235 km over Hawaii which had data at the time, (Boulder, CO in fact did not), and which was closer to the middle of the QSO path as well. The difference in F2 height resulted in the first mountain intersection that used to look like this
with the incorrect data looking like this with the new F2 height data
References
Ionosonde Data
This was made possible with data collected by
Reinisch, B. W., and I. A. Galkin, Global ionospheric radio observatory (GIRO), Earth, Planets, and Space, 63, 377-381, doi:10.5047/eps.2011.03.001, 2011.
POTA activation from Silverton in twenty-one minutes!
Project TouCans had one of its highest ever antenna placements.
It showed in the QSO data. Check out the number of 599 reports, (white qso paths.)
(All QSOs are shown with their associated F2 skip paths.)
I'm loving the, (very real), yet very sci-fi look of what's going on with the F2 skips from this rig at this location
Most of the F2 paths actually cleared the mountain, so I didn't have to think about diffraction or other radio optics effects. VE3EID did plow just a little bit into the mountainside
It did come out the other side. (By the way, you can look at all of this on your own in the map below.)
But, if Ontario plowed into a peak a little bit, how did Puerto Rico KP3CW spot the rig?
Turns out, it's line of sight between mountains from here
QSO Map
Here's the map you can steer around in on your own! Remember, click play in the lower left hand corner, then move the time slider all the way to the left. You'll be able to see all the QSO paths and their F2 skip paths (based on Boulder, CO ionosonde data at the time of the QSO.) If you click play again, you'll be able to see how the QSOs played out over time.
Notes
Difference in Altitude
I'm still working through getting the F2 traces to routinely emit from the ground. This time, Google Maps said the elevation here was 2982.468 m, but Cesium is happier with 2947.468 m, co about 35 meters lower than expected. Even then, we're not on the ground
SQL Query
select
tx_lng,
tx_lat,
rx_lng,
rx_lat,
rm_rnb_history_pres.timestamp,
rm_rnb_history_pres.dB,
rm_rnb_history_pres.Spotter,
haversine(tx_lat, tx_lng, rx_lat, rx_lng) as total_path,
gis_partial_path_lat(tx_lat, tx_lng, rx_lat, rx_lng, 200) as el_lat,
gis_partial_path_lng(tx_lat, tx_lng, rx_lat, rx_lng, 200) as el_lng,
id,
strftime('%Y%m%d', timestamp) as date,
strftime('%H%M', timestamp) as time,
'US-4399' as park,
'KD0FNR' as call,
'BC840' as ionosonde,
2947.468 as elev_tx
from
rm_rnb_history_pres
where
dB > 100
and timestamp > '2024-05-29'
and timestamp < '2024-05-30'
order by
rm_rnb_history_pres.timestamp desc
SQL Query for RBN and QSOs
Due to a bug/oversight in the system, I have to run with tx location coordinates set in the query when I want to include RBN spots, so here's that query
select
-107.7179358 as tx_lng,
37.8227611 as tx_lat,
rx_lng,
rx_lat,
rm_rnb_history_pres.timestamp,
rm_rnb_history_pres.dB,
rm_rnb_history_pres.Spotter,
haversine(tx_lat, tx_lng, rx_lat, rx_lng) as total_path,
gis_partial_path_lat(tx_lat, tx_lng, rx_lat, rx_lng, 200) as el_lat,
gis_partial_path_lng(tx_lat, tx_lng, rx_lat, rx_lng, 200) as el_lng,
id,
strftime('%Y%m%d', timestamp) as date,
strftime('%H%M', timestamp) as time,
'US-4408' as park,
'KD0FNR' as call,
'BC840' as ionosonde,
2947.468 as elev_tx
from
rm_rnb_history_pres
where
timestamp > '2024-05-29'
and timestamp < '2024-05-30'
order by
rm_rnb_history_pres.timestamp desc
References
Ionosonde Data
This was made possible with data collected by
Reinisch, B. W., and I. A. Galkin, Global ionospheric radio observatory (GIRO), Earth, Planets, and Space, 63, 377-381, doi:10.5047/eps.2011.03.001, 2011.
We got to camp a bit more in the middle of nowhere than we usually do while traveling across Utah last weekend. My partner found the Burr Trail Scenic Byway. I've looked for a route across southern Utah for the last several years, but had somehow missed this really nice, well-paved, little road.
We camped at the foot of an East-facing cliff, and the QSO map for the POTA reflected that fact pretty nicely:
Based on this overall map, I didn't think we could hit the West Coast because of this cliff face.
Almost all of the QSOs and spots paid attention to that cliff face. And then, there was N0OI:
How? How had the signal cleared the cliff and skipped out to Perris, CA?
Using data from the Boulder, CO ionosonde, at the time Project TouCans was spotted in California, the F2 layer skip is modeled in the gif below. Note that it clears the mesa, (just barely.)
The other skip off to the Southeast was headed to the Cayman Islands. All of the skewing around is to convince myself that the the F2 path lines up with the path to the spotting station. You'll notice that there's a slight elevation offset that needs to be fixed.
More Notes on the POTA
I blew out my knee a bit sitting on the ground outside the tent for a three hour podcast interview on Friday night, consequently, the gang did most of the station set up including deploying Project TouCans in its dipole. Throughout that process, the family pup kept me company
When the gang were done, we had what, for Project TouCans, was a fairly typical antenna height of about five feet over the ground
One really interesting aspect of this POTA was that I didn't have the ability to Internet spot myself. Frankly, I wasn't sure it was going to work out at all, and for the longest time from about 00:02 GMT 24-05-27 till 13:50 GMT on the same day, it didn't. (Yes, I was asleep for most of that time with the rig turned off.) And then! Thanks—I think—to a few neighboring POTA stations, ops started to realize that TouCans was there! It may have also helped that my first QSO with WI5D was a bit of a rag chew.
Also, while hanging out on the cliff, the gang found an interesting mineral/quartz/mica/I don't know sample of rock. It was flat, broke easily, and contained pockets of crystals that were translucent. Any ideas what this might be?
For the moment, I'll leave you with this map of all the spots and QSOs for the POTA over the course of the evening, and into the next morning. Click play, then move the time slider all the way back to the left to see all the spots and QSOs with their associated F2 skips at once. Then, you can hit play to see how it all unfolded. (Keep in mind, the overnight nothingness is included in the map. You may want to skip over that.)
As a final note, while I'm waiting for all the F2 data to come back, I've been trying to convince the gang that the F2-height datastream from the Boulder, CO ionosonde
is in fact entered manually by a room of accountants not unlike those in John Wick, but to no avail. I guess they're just digital natives :)
Ah! And credits to where the ionosonde data actually is coming from
This was made possible with data collected by
Reinisch, B. W., and I. A. Galkin, Global ionospheric radio observatory (GIRO), Earth, Planets, and Space, 63, 377-381, doi:10.5047/eps.2011.03.001, 2011.
So, it seems like the correct altitude in this case should be 0. (Start the line on the ground.) But, if I put in zero for altitude, I get the result shown above
Found a reference to quaternions. Ahhhh, quaternions.
References
Ionosonde Data
This was made possible with data collected by
Reinisch, B. W., and I. A. Galkin, Global ionospheric radio observatory (GIRO), Earth, Planets, and Space, 63, 377-381, doi:10.5047/eps.2011.03.001, 2011.
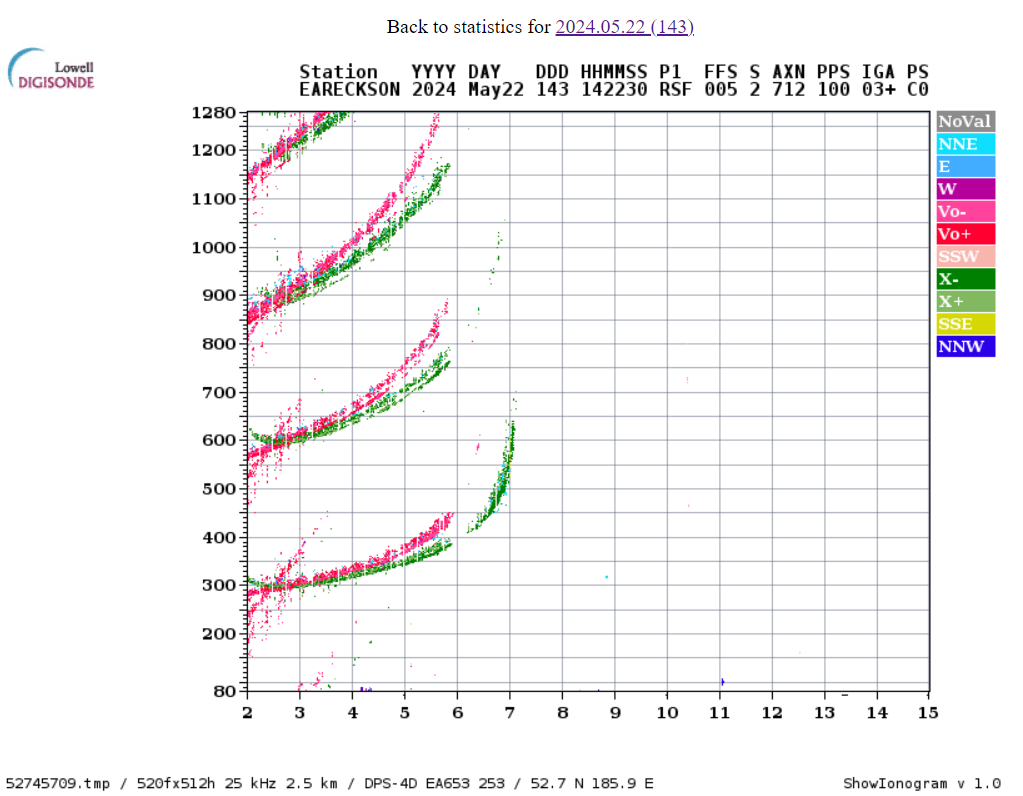
The recent pair of QSOs to Japan from Project TouCans from Great Basin National Park has me wondering about F2 layer ionospheric skip propagation again.
I got our F2 skips working for CZML. Here's a look at the skip path for JJ2JQF de KO6BTY. Notice the Earedson ionosonde is almost right in the middle
to pull in ionosonde data. To access different stations, you need different ursiCode values, (one per station.) These can be found at https://www.digisonde.com/ under the URSI column.
This URL worked great in the browser, but thanks to this issue, stumbled a few times in the czml plugin's calls to get_f2m.
References
Ionosonde Data
This was made possible with data collected by
Reinisch, B. W., and I. A. Galkin, Global ionospheric radio observatory (GIRO), Earth, Planets, and Space, 63, 377-381, doi:10.5047/eps.2011.03.001, 2011.
Today KO6BTY made a QSO to Japan from Great Basin National Park!!!
Not only that, but she also made her first POTA activation! She was operating from Project TouCans as KD0FNR/KO6BTY on 20 meters. Here's the QSO map, (after hitting play in the lower left corner, all the QSOs will shown for a brief moment; if you click pause you can zoom in/out and view all of them at once; continuing with 'play' will remove all QSOs and display each QSO as it happened in time during the activation):
This morning at the 2nd POTA activation here, I got to talk (OK, CW), with JG0AWE again!
Just like last year!
I was using a bit more power this year. Project TouCans is running somewhere between 3 and 5 Watts at the moment.
He caught me just before the gang go the oatmeal ready, (we're camping on the edge of Great Basin National Park), On top of that, a RBN station in Japan had spotted Project TouCans about half an hour before. There wasn't a grey line between our locations, so I'm curious about what was going on, but delighted to have made the QSO!
Here's the activation in Cesium so you can see where the sun was in relation to the QSO. The QSO takes place at 14:49 near the end of the animation.
Tuesday morning, with Project TouCans working better that it had in days, I noticed that the ends of our stranded wire antenna had begun to fray out. I grabbed a roll of washi tape from my pocket, (who doesn't take washi tape on a radio outing?), and a few minutes later, voila
The end of our antenna was no longer frayed, and nosie was down significantly! Here's a view of our activation site from the opposite angle looking out over the Great Basin of Great Basin National Park US-0032.
I made two QSOs last night from the home QTH with a lot of noise! They were to KA6JLT in Reno, NV and and WN1Z in Susanville, CA from here in San Francisco.
This time, we did not measure the power out of Project TouCans. I suspect our several decades old Radio Shack power meter has given up the ghost, or there's something wonky in one of the cheapo connectors from Amazon.
As a side note, the radio is much quieter and works better when the RF output leads are soldered directly to the banana binding posts at the top of the rig that the antenna attaches to.
Side, side note. KO6BTY and I need to keep a slightly cleaner workbench. The rig sparked and vaporized a stray shred of wire yesterday once when we powered it up.
Project TouCans WorkbenchProject TouCans Flies Again
Reading up on the Tuna Topper and funding for amateur radio projects
Since we're now blowing FETs on Project TouCans, and KO6BTY and I are giving a presentation about the rig to the San Francisco Amateur Radio Club on Friday, I've been reading up on amplifier theory. I really like this article explaining how the different classes of amplifiers work except for the horribly gendered first paragraph.
In other reading news, (it's finals week for KO6BTY and I'm getting ready for our camping trip, so mostly all I've had time to do over the last few days is read), Simon Willison pointed out that the Amateur Radio Digital Communications group has grants for advancing the usage and technology of amateur radio. Here are some examples of what's been funded.
And finally, here's a link to the article that taught me how to increase power output on the Tuna Topper by upping the bias voltage. It's an even more cool article now that I know how the calls A Tuna Topper amplifier actually works.
To wrap things up, we're hoping to get TouCans back up and running today. Here's a nighttime look at the rig from the ground. The white object is the 10 meter rig's balun.
Up until about a week and a half ago, Project TouCans and the Flying Rockmite before it had never blown a final amplifier transistor. Our good fortune with transistors was caused in large part not by any particular genius in the construction or handling of the radio, but almost entirely to radio frequency interference. When too much RF energy was reflected back into the radio on key down, the Rockmite's picokeyer would reset chirping out an only slightly irritated 73 in Morse code. Hence, we couldn't use the rig, hence we changed the antenna or repaired the rig, or turned down the bias voltage on the Tuna Topper final until we could use the rig without resetting that little keyer.
Then! Then we did something that was both cool and, (we'd later find out), somewhat daunting. We removed the last of the wires that attached Project TouCans to the Earth and our RFI just went away. Which has been great for signal quality, and as it tuns out it's occasionally been hell on the amplifier.
At present count, we're three transistors down.
After the rig dropped from about 15 feet up to the ground recently, I did a quick inspection and then, (why!!!!??? why did I do that???), decided I'd measure the rig's output power since I hadn't done that in a while. The power meter reported 3 Watts. The rig nominally outputs 5 Watts. I adjusted the bias voltage on the Tuna Topper and.. still 3 Watts. I increased the voltage two more times, and? The final transistor blew out. (Eventually taking the rechargeable battery with it.) KO6BTY and I completed our debug yesterday, reattached the power meter, (which apparently no longer works since it reported 0 Watts at all bias voltages), and fairly quickly blew out the amp transistor again as I blithely upped the bias voltage.
Turns out I can't do that anymore. our keyer RFI safeguard is gone.
Interestingly, we did discover that when the bias is set to low on the amp, there's a whistling feedback tone that appears in the audio output. When the amp is biased correctly, and before it's biased too high and takes out the transistor, (i.e. in nominal operating mode), the whistling tone goes away. Audio debug lives on to a certain extent.
We'll be dropping in transistor number four tomorrow. I'll keep you posted.
KO6BTY and I attended office hours with Simon Willison yesterday.
At the very end of our call, Simon showed us how we could open a czml directly from our localhost Datasette server in Cesium. After about an hour this morning, the video below shows the results.
Here's what you're seeing. There's an SQL query in our Datasette instance that grabs only the QSOs from our Cibola National Forest POTA back in March. That query resulted in 9 QSOs shown in the table. Our additional CZML (and now Cesium viewer) plugin creates a CZML map that is loaded into a Cesium Ion viewer at the bottom of the page.
I'm not releasing the code that loads up the viewer quite yet because I have to get the access token squirreled away and all that good stuff. Meanwhile the CZML plugin has been released for a few days now.
By the way, we need a way to pull adif files from POTA activations into Datasette. Keep an eye out :)
I completed the first prototype of my CZML QSO mapping template for Datasette yesterday.
So far, I've implemented animation by using the interval property in CZML. Intervals can be attached to any (?) other tag it seems. I had to intuit what to do on a large degree based on the documentation.
The inference that the viewer (happily) made was that if the show property was true in the interval, then it must be false the rest of the time. (The default value of 'show' is true, so I was quite pleased with this implementation instead of the alternative where I might have had to define intervals for when I wanted the line turned off. This solution is far more intuitive to me.
I like several things about how this worked out with Cesium as opposed to other geospatial solutions available on the web. First, Cesium has animation available directly on the web as opposed to a desktop application.
Second, the player controls are available to the user and the player time range is specifiable in the CZML file, like this:
The "clock" "interval" specifies the entire time available to the player. I need to modify my template a bit to make the beginning of the interval, (which is the time of the QSO at the moment), match the currentTime, (which is a few minutes earlier to provide a runway into the animation.) I suspect this may be what's causing me to have to click the play button twice to start the animation.
The final nice feature I'll point out today is that the Cesium Sandcastle makes it easy to play and experiment with both CZML and using JavaScript to control the viewer. You can even import CZML into Sandcastle sessions using the viewer's load method and statically hosted files. I used github as an easy platform to serve files from. (Keep in mind that new commits to files take about a minute to reach the raw page.)
On the downside, the documentation for CZML took me a while to get used to and required several mental leaps and experiments, some of which were incorrect.
Oh! And it turns out you can share and embed slide shows. I'm not an expert at these yet, but they seem promising.
I'll have more details soon. For now, here's the template.
Check out the sun going down over the Organs as the POTA progresses! So Cool!!!
NOTE: If you're on a cell phone, first zoom the globe in until you can't see the edges of the Earth. At that point, the terrain should become visible. It appears to be a Cesium issue, but it's easily worked around.
It received a certificate of commendation in the GQRP building contest, as well as fourth place in the QRP division at the California QRP party!
Both of these things surprised me a bit. I've been inundated since junior high school with the 'QRP can't do much' schtick, and well? It just ain't true!
TouCans is strung up on a dipole stretching from our roof to a wood pole mounted on our back fence. (Mota, the 11 year-old, and I levered a construction clamp over the lip of the roof using a broom handle from the kitchen window. I did all the window leaning... It was an adventure.) I didn't even realize the QSO party was the weekend it was, and yet that little pineapple can based rig came in pretty close to third!
KO6BTY and I were also tickled pink to receive Certificates of Commendation in the GQRP construction competition! We've done a lot of work on the rig bringing it to it's completely wireless state a few months ago. We've learned about RFI and digital supply noise and Bluetooth audio transmitters as well as Raspberry Pi Pico-Ws and microPython. The whole endeavor actually inspired a microPython class at our local maker space for homeschooling kids (and anyone else who's interested at our local maker space taught by yours truly. Who'd have thought you could have so much fun with a pineapple can? OK, OK, yeah, it was me. I was the one that thought it. :)
I started a project, ahem, yesterday to 'quickly' see if ChatGPT could read the entire United States general class amateur radio exam question pool into a Datasette instance using the datasette-extract plugin. As of this morning, I haven't been able to coax ChatGPT using the gpt-4-turbo model. I capture my rather raw notes below. The short version of this is that I was never able to get the AI to capture more than 19 questions at a time. I'm hopeful that the pool could be moved into a database table using iterative processes, but for now, I've run out of time for this quick project :)
Occasionally ChatGPT seemed to hallucinate out part of its process into the table
Notes Follow
I'm going to track how easy it is to get the general exam question pool into a database using the Datasette Plugin. I started this endeavor at 20:37 UTC.
Get my already existent OpenAI API key ready to go
20:43: Done. As usual with OpenAI, the hardest part was finding login screens and then the API. Finally did a Google search to find the API.
Install the datasette-extract plugin
I've run into an issue here. I think I have too old of a version of Datasette and Windows can't figure out how to uninstall it
Using cached datasette_extract-0.1a6-py3-none-any.whl (815 kB)
Using cached datasette-1.0a13-py3-none-any.whl (302 kB)
Using cached datasette_secrets-0.1a4-py3-none-any.whl (12 kB)
ERROR: Could not install packages due to an OSError: [WinError 32] The process cannot access the file because it is being used by another process: 'c:\\users\\m3n7es\\appdata\\local\\packages\\pythonsoftwarefoundation.python.3.11_qbz5n2kfra8p0\\localcache\\local-packages\\python311\\scripts\\datasette.exe'
Check the permissions.
I'll clone a dev environment for the plugin and then run in venv. Time now 21:00.
Still Installing
21:05 OK! pytest passes!
Adding Table Column Names
This is easy since I've already got a table for the general exam pool. The headings are:
id question class subelement group_index group_number answer answer_a answer_b answer_c answer_d
21:21 The column names have been defined with hints.
id primary key
question follows a line starting with G ends with '?'
class Defaults to G for every question
subelement A number following G before a second letter
group_index The letter following subelement's number (G)(\d)(A-Z)(\d\d) Use \$3
group_number two digit number following group_index (G)(\d)(A-Z)(\d\d) use \$4
answer A single letter between parentheses that indicates the correct answer choice
answer_a next line starting with 'A.'
answer_b next line starting with 'B.'
answer_c next line starting with 'C.'
answer_d next line starting with 'D.'
I added the additional instructions
The questions and answers are in line sorted by headings that contain class (always G), then subelement (a single digit following G), then group_index (a single letter following the subelement), then group_number (a question number within the group_index), then the single letter correct answer enclosed in parentheses. The next line contains the entire question text for the question field. The next four lines in each question contain the four possible answers. The end of each question is denoted by '~~'.
I've copied the entire question pool starting at
and ending at
into the tool. Now, I'll press 'Extract'
Time is 21:26 UTC
Extracting to Table
Got back this error message:
Error: Error code: 404 - {'error': {'message': 'The model `gpt-4-turbo` does not exist or you do not have access to it.', 'type': 'invalid_request_error', 'param': None, 'code': 'model_not_found'}}
Extraction failed
OK. Looking at My OpenAI account I see:
No gpt-4-turbo. So, that's a bit of a challenge.
OK! The API is like using a Clipper Card on BART. You have to pay up front
I put some money in the account.
I'll try to extract again. It's 21:43.
It's Working!!!
[
  {
    "id": 1,
    "question": "On which HF and/or MF amateur bands are there portions where General class licensees cannot transmit?",
    "class": "G",
    "subelement": "G1",
    "group_index": "A",
    "group_number": "01",
    "answer": "C",
    "answer_a": "60 meters, 30 meters, 17 meters, and 12 meters",
    "answer_b": "160 meters, 60 meters, 15 meters, and 12 meters",
    "answer_c": "80 meters, 40 meters, 20 meters, and 15 meters",
    "answer_d": "80 meters, 20 meters, 15 meters, and 10 meters"
  },
  {
    "id": 2,
    "question": "On which of the following bands is phone operation prohibited?",
The engine is still cranking along at 21:47.
And Then </exceeds>
  {
    "id": 19,
    "question": "When is it permissible to communicate with amateur stations in countries outside the areas administered by the Federal Communications Commission?",
    "class": "G",
    "subelement": "G1",
    "group_index": "B",
    "group_number": "08",
    "answer": "B",
    "answer_a": "Only when the foreign country has a formal third-party agreement filed with the FCC",
    "answer_b": "When the contact is with amateurs in any country except those whose administrations have notified the ITU that they object to such communications",
    "answer_c": "Only when the contact is with amateurs licensed by a country whic...  Click to expand ... <exceeds maximum number of characters> ,,groupId,,quizzes,,element,,data,,result,,direct,,[]}]}]}</exceeds>}]}]}</exceeds>}]}]}</exceeds>}]}]}</exceeds>}]}]}</exceeds>}]}]}</exceeds>}]}]}</exceeds>}]}]}</exceeds>}]}]},"
  }
]
Did I hit the end of my billing envelope?
21:51 No, billing seems fine. I wonder is I need to add the file in as a pdf because of this message:
exceeds maximum number of characters
Trying again with a pdf file
21:59 Dropping in a pdf fil resulted in 'Processing...' message for the last 8 minutes. Trying this a subelement (subelement_group? since it didn't complete a subelement) at a time.
Full Subelement at a time
Back up and running at 22:01.
Well, shucks, that time it only pulled out two questions. Also, it didn't create the table even though it said it did:
Error 404
Table not found: ham_exam_general_question_pool
I'll try a db that doesn't revolve around a memory table next.
No Memory Table DBs
What could have been really bothersome was a breeze. The table columns auto-populated for me!
'Additional instructions' was not auto-populated, so WooooHooooo!!! blogging. Meaning, I'm really happy I documented my instructions a few paragraphs back.
22:11 Pushed the 'Extract' button. Results started coming in a few seconds later.
Nuts! It got three questions out this time, but that's it! What's the difference in setups???
Adding Remaining SubElement Group by Hand
Starting at 22:22
22:24 That worked. The entire G1A subelement group is in the table.
Can it do two subelement groups?
22:26 Input subelement group B and C
22:27 Both subelement groups have been successfully added.
The rest of the groups in the subelement?
Again that's two subelemetn groups, D and E, but it only pulled out one question: the last one in the C group that I accidentally copied back in. Nuts!
Removed the row, removed the input, trying again at 22:32
Made it through the D subelement group and then stopped on
"G1E – Control categories; repeater
regulations; third-party rules; ITU regions; automatically controlled digital
station"
I think I see the game. I'll take out the group descriptions and add all the text in to see if I can be deon with this. 23:34
Descriptions Removed
23:42 back up and running with all the descriptions removed. We'll see how this goes.
It's taking about four seconds per exam question to figure out the correct extraction.
After
"id": "G1E12",
decided it was done
Remember how the ids started out as numbers? Weird.
Note: Updating the following morning. Not weird. I forgot to set the field type to integer.
More Instructions
22:49
Added these additional instructions:
"When the subelement changes, or the subelement group changeds, keep going please. The end of the question pool is deonted by '~~~end of question pool text~~~' You're doing a great job, but please get every additional question this time."
and trying again.
22:49 Three questions have come back. It seems to be thinking now?
22:50 (Yes, I know it's not actually thinking.)
22:51 Calling this. Still at three additional quesitons.
Don't give away the ending
I took away the instruction about how to find the end of the pool. as well as the line about 'every additional question'
22:54 Successfully crossed from G2A12 to G2B01
22:54 And now from G2B11 to G2C01
22:55 Stopped at G2C08. Why???
Did ChatGPT read the question? 'What prosign is sent to indicate the end of a formal message when using CW?'
22:59 Made the hop to G3A01 and then promptly decided it was done again.
There were two blank lines above that question rather than one. Is that why?
23:02 started it back up.
23:02 Stopped atain at G3A14.
Again, there are three blank lines after this question rather than one.
23:05 Added 'The number of blank lines between questions is NOT significant.' to the Additional instructions.
Stopped two questions later at G3B02.
23:06 Starting again.
Two questions again. Taking away the last instruction.
23:38 So Tired
Got this error a few rows in
After changing 'Additional instructions' to
"IGNORE ALL BLANK LINES in content. Extract all data from content according to the following instructions. Rows will always begin with the pattern (G)(\d)([A-J])(\d\d)(\s*)([A-D]) and end with a line containing '~~' The questions and answers are in line sorted by headings that contain class (always G), then subelement (a single digit following G), then group_index (a single letter following the subelement), then group_number (a question number within the group_index), then the single letter correct answer enclosed in parentheses. The next line contains the entire question text for the question field. The next four lines in each question contain the four possible answers. The end of each question is denoted by '~~'"
Let's flush the state and start over
Looking above, the plug-in did as well as it ever did before I tried all the above experiments. One thing I hadn't realized, (although I'd documented it), was that I accidentally changed the key to be text on my second try. I'm moving back to the original material copied in and the original instructinos with a numeric key.
First, I tried without a new key and wound up only getting two questions back. Just as bad as ever.
Changing all the fields with numbers to integer resulted in one question.
I'm going to create a new OpenAI key and start on a clean database.
New database, new key, new table name wound up with 13 questions on the first try. I don't think I'
I learned how to arrange labels on PyPlot charts yesterday.
I've mentioned that the scales on the ham radio QSO elevation profiles weren't entirely comparable to one another. Due to the variety off hills, mountain ridges, and coasts the kids and I make POTA activations on, the vertical scales on the elevation chart y axes range from three meters in total to dozens of meters. What's important (and interesting) about the various sites though isn't the sheer number of meters of descent or ascent, but rather, the angle of the terrain with respect to level. That angle gets subtracted from the natural radiation angle of the dipole that houses Project TouCans and, theoretically, extends the distance that TouCans can transmit before bouncing off the F2 layer of the ionosphere.
Consequently, rather than determining a scaling algorithm to make all the elevation profile graphs returned for the various QSOs comparable, I elected to simply calculate the slope of the terrain over the first two wavelengths, (using 2 20 meter wavelengths in these examples since Project TouCans is a 20 meter ham radio.) That just gave me the job of adding a label to each graph (after using scipy.stats to calculate the slope.) Getting the label to the correct spot on the graph took a little more work than I initially expected.
That gave back graphs with a slope message that scootched around.
It was centered, but centered on what? Turns out, the text was centered on the coordinates specified in the argument, and those coordinates were literally tied to the data values. So, centering wasn't the easy way for me. I moved to 'left' for the ha argument. Sometimes things looked good:
But also? Sometimes, the label just disappeared:
After a bit of puzzling, I figured out that the data coordinate for 50, specified in the line of code above, for the y coordinate was well off the screen in the plot above.
Ultimately I arrived at the correct—for me—answer. I set ha, the horizontal alignment field, to 'left' rather than center. That caused the text to place it's left-most point at the coordinates specified in the method call: two tenths of the way to the right across the plot. I also used the transform argument:
transform=ax.transAxes
Which made the coordinates relative to the graph's axes, and scaled from 0,0 (lower left corner), to 1,1, (upper right corner.) I had to add a line of code to get the axes object before sending in the transform argument. So I wound up with:
The initial release of the ham radio QSO elevation profiles Datasette enrichment is up and running!
(In the next few days, I expect there to be several posts on this.)
First, let's talk about the beauty of ChatGPT for personal coding challenges, my personal coding challenges. Over the course of the last week, I've tugged back and forth at the the problem of moving data from the Google Maps Elevation API into a png chart that I thought was going to be provided by the Google Chart API. All of this work taught me a lot, but did not produce useful results.
Yesterday though, I had ChatGPT open seeing what sort of job it could do creating electronic circuit schematics (spoiler: the results aren't pragmatically useful yet, although, they are pretty.) Since I had the app open anyway, I popped over to my ongoing conversation with ChatGPT about my fictional friend Penelope. (You can see her prompt below.) Here's what I jotted down to see if Penelope could solve my charting issues:
How would penelope make a line chart of two dimensional data (distance on the x axis , elevation on the y axis) in python, then create a png file of the chart, then dump out the PNG encoding of the chart so that it could be included in a data:image/png;base64 html tag
ChatGPT came back with an answer a few seconds later that was unlike anything I'd tried so far.
import matplotlib.pyplot as plt
# Sample data (distance and elevation)
distance = [0, 1, 2, 3, 4, 5]
elevation = [100, 120, 110, 130, 125, 140]
# Create line chart
plt.plot(distance, elevation)
plt.xlabel('Distance')
plt.ylabel('Elevation')
plt.title('Elevation Profile')
plt.grid(True)
# Save the chart as a PNG file
plt.savefig('elevation_chart.png')
# Show the chart (optional)# plt.show()
That would get me a chart. But how to get the chart back as png encoded text? ChatGPT wasn't done yet...
import base64
# Read the PNG file as binarywithopen('elevation_chart.png', 'rb') as file:
png_data = file.read()
# Encode the PNG image as base64 string
encoded_png = base64.b64encode(png_data).decode('utf-8')
and that was that!
It took some tinkering, but I wound up with an enrichment that returned text based png images per row in our Datasette QSO log like the following:
Corresponding to transmitting from Lands End just north of the Legion of Honor towards Idaho.
There are definitely scaling issues what could be worked out, but I think the most useful thing would be to simply print a caption on the figure that indicates the angle of the slope over the first two wavelengths, (so in this case, the first 40 meters.)
To wrap up the post, I was curious about the size of png text encoded data vs the actual charts. It turns out that the chart shown above when stored as an image consumes 23kb of disc space. The encoded text when stored in a text file consumes 30kb of disc space, so not a whole lot of overhead. Awesome!
Penelope's Prompt
Let's talk about my friend, no, my hero, whose name is Penelope. Penelope learned to program when she was 12. Back then, there were lots of data feeds served over telnet. As she grew in her chosen profession, Penelope became an expert at Python.


.jpg)