❌

Normal view

There are new articles available, click to refresh the page.
Before yesterdayMain stream

Threading the Valley: Australia from Colorado on 20 meters and 5 Watts with Project TouCans

Β The gang and I made our first QSO with Australia this week!

The QSO came bundled with two other DX contacts made with Project TouCansβ€”all in a 16 minute windowβ€”which I'll write about soon. Our camping site is nestled below Anvil Mountain to the East and across the Million Dollar Highway from South Mineral Springs, about two miles north of Silverton, CO. We're surrounded by peaks on all sides. Bear Mountain peak is framed in my pictures of the rig.

Project TouCans was probably 20 feet up in its dipole. This turned out to be difficult to show in photographs with the proper perspective. I finally decided to make a gif of different zoom levels of a single photo. The picture below starts out focused on Bear Mountain Peak and then zooms out to include the rig and the ground outside my partner's and my tent.


You can see the Bluetooth transmitter that brings the head phone audio down to the ground hanging from the bottom of the rig.

The campsite is gorgeous and almost completely bug free. I managed to make it out on one hike. Tawnseβ€”the nine year-oldβ€”our puppy, and I were treated to views like this


Notice the mountains lurking very nearby in every shot.

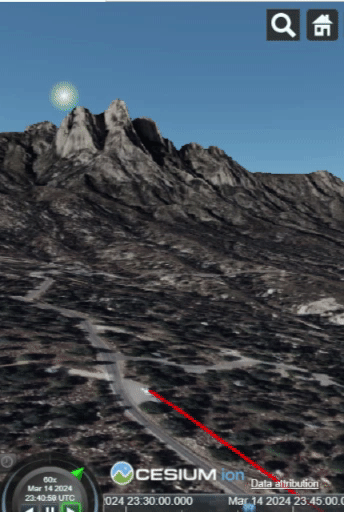
That brings us to the circumstances of the QSO with VK3YV, the first DX QSO of that morning. Here's our campsite from a way's out showing the F2 skip path (estimated using real-time data from the Boulder, CO ionosonde), as well as the path of the QSO along the ground.Β 


Zooming in a bit reveals just how many peaks we were surrounded by and shows our location relative to Silverton.

So, with all those mountains in the way, how did we talk to Australia?

Project TouCans threaded the valley to the west of our campsite! Check this out!

I'll leave you with the map of the QSO so you can trace along the path at your leisure. Use the time control in the lower left corner or the slider along the bottom of the map to locate the QSO at 12:40 UTC. From there, you can zoom in and out using a mouse center-button wheel. You can also tilt by holding down the control key, and then moving the map using the left mouse button.


Update

Due to a bug in the ionosonde code that I'd immediately introduced, the F2 layer height was not 307 km as shown in the diagram above. It was in fact, 235 km over Hawaii which had data at the time, (Boulder, CO in fact did not), and which was closer to the middle of the QSO path as well. The difference in F2 height resulted in the first mountain intersection that used to look like this


with the incorrect data looking like this with the new F2 height data


References

Ionosonde Data

This was made possible with data collected byΒ 

US-4408 Project TouCans POTA Activation Outside of Silverton, CO

Β POTA activation from Silverton in twenty-one minutes!

Project TouCans had one of its highest ever antenna placements.


It showed in the QSO data. Check out the number of 599 reports, (white qso paths.)

(All QSOs are shown with their associated F2 skip paths.)

I'm loving the, (very real), yet very sci-fi look of what's going on with the F2 skips from this rig at this location


Most of the F2 paths actually cleared the mountain, so I didn't have to think about diffraction or other radio optics effects. VE3EID did plow just a little bit into the mountainside

It did come out the other side. (By the way, you can look at all of this on your own in the map below.)

But, if Ontario plowed into a peak a little bit, how did Puerto Rico KP3CW spot the rig?Β 

Turns out, it's line of sight between mountains from here


QSO Map

Here's the map you can steer around in on your own! Remember, click play in the lower left hand corner, then move the time slider all the way to the left. You'll be able to see all the QSO paths and their F2 skip paths (based on Boulder, CO ionosonde data at the time of the QSO.) If you click play again, you'll be able to see how the QSOs played out over time.


Notes

Difference in Altitude

I'm still working through getting the F2 traces to routinely emit from the ground. This time, Google Maps said the elevation here wasΒ 2982.468 m, but Cesium is happier withΒ 2947.468 m, co about 35 meters lower than expected. Even then, we're not on the ground


SQL Query

select

Β  tx_lng,

Β  tx_lat,

Β  rx_lng,

Β  rx_lat,

Β  rm_rnb_history_pres.timestamp,

Β  rm_rnb_history_pres.dB,

Β  rm_rnb_history_pres.Spotter,

Β  haversine(tx_lat, tx_lng, rx_lat, rx_lng) as total_path,

Β  gis_partial_path_lat(tx_lat, tx_lng, rx_lat, rx_lng, 200) as el_lat,

Β  gis_partial_path_lng(tx_lat, tx_lng, rx_lat, rx_lng, 200) as el_lng,

Β  id,

Β  strftime('%Y%m%d', timestamp) as date,

Β  strftime('%H%M', timestamp) as time,

Β  'US-4399' as park,

Β  'KD0FNR' as call,

Β  'BC840' as ionosonde,

Β  2947.468 as elev_tx

from

Β  rm_rnb_history_pres

where

Β  dB > 100

Β  and timestamp > '2024-05-29'

Β  and timestamp < '2024-05-30'

order by

Β  rm_rnb_history_pres.timestamp desc

SQL Query for RBN and QSOs

Due to a bug/oversight in the system, I have to run with tx location coordinates set in the query when I want to include RBN spots, so here's that query

select

Β  -107.7179358 as tx_lng,

Β  37.8227611 as tx_lat,

Β  rx_lng,

Β  rx_lat,

Β  rm_rnb_history_pres.timestamp,

Β  rm_rnb_history_pres.dB,

Β  rm_rnb_history_pres.Spotter,

Β  haversine(tx_lat, tx_lng, rx_lat, rx_lng) as total_path,

Β  gis_partial_path_lat(tx_lat, tx_lng, rx_lat, rx_lng, 200) as el_lat,

Β  gis_partial_path_lng(tx_lat, tx_lng, rx_lat, rx_lng, 200) as el_lng,

Β  id,

Β  strftime('%Y%m%d', timestamp) as date,

Β  strftime('%H%M', timestamp) as time,

Β  'US-4408' as park,

Β  'KD0FNR' as call,

Β  'BC840' as ionosonde,

Β  2947.468 as elev_tx

from

Β  rm_rnb_history_pres

where


Β  timestamp > '2024-05-29'

Β  and timestamp < '2024-05-30'

order by

Β  rm_rnb_history_pres.timestamp desc

References

Ionosonde Data

This was made possible with data collected byΒ 


More F2 Skip Cesium Development Notes

Β Here's the query I'm using for Burr Trail


============================================

select

Β  tx_lng,

Β  tx_lat,

Β  rx_lng,

Β  rx_lat,

Β  rm_rnb_history_pres.timestamp,

Β  rm_rnb_history_pres.dB,

Β  rm_rnb_history_pres.Spotter,

Β  haversine(tx_lat, tx_lng, rx_lat, rx_lng) as total_path,

Β  gis_partial_path_lat(tx_lat, tx_lng, rx_lat, rx_lng, 200) as el_lat,

Β  gis_partial_path_lng(tx_lat, tx_lng, rx_lat, rx_lng, 200) as el_lng,

Β  id,

Β  strftime('%Y%m%d', timestamp) as date,

Β  strftime('%H%M', timestamp) as time,

Β  'US-4399' as park,

Β  'KD0FNR' as call,

Β  1770.829467773438 as elev_tx

from

Β  rm_rnb_history_pres

where

Β  dB > 100

Β  and timestamp > '2024-05-27'

Β  and timestamp < '2024-05-28'

order by

Β  rm_rnb_history_pres.timestamp desc

=======================================================


At some point I'll add an ionosonde field using this map for each QSO. For the Boulder, CO ionosonde, the query will look like

=========================================================

select

Β  tx_lng,

Β  tx_lat,

Β  rx_lng,

Β  rx_lat,

Β  rm_rnb_history_pres.timestamp,

Β  rm_rnb_history_pres.dB,

Β  rm_rnb_history_pres.Spotter,

Β  haversine(tx_lat, tx_lng, rx_lat, rx_lng) as total_path,

Β  gis_partial_path_lat(tx_lat, tx_lng, rx_lat, rx_lng, 200) as el_lat,

Β  gis_partial_path_lng(tx_lat, tx_lng, rx_lat, rx_lng, 200) as el_lng,

Β  id,

Β  strftime('%Y%m%d', timestamp) as date,

Β  strftime('%H%M', timestamp) as time,

Β  'US-4399' as park,

Β  'KD0FNR' as call,

Β  'BC840' as ionosonde,

Β  1770.829467773438 as elev_tx

from

Β  rm_rnb_history_pres

where

Β  dB > 100

Β  and timestamp > '2024-05-27'

Β  and timestamp < '2024-05-28'

order by

Β  rm_rnb_history_pres.timestamp desc

limit 1

====================================================================

The extra ionosonde field works!!!Β 

References

Ionosonde Data

This was made possible with data collected byΒ 


Things I (didn't) Learn (yet): Setting Elevation of Line Endpoints in Cesium CZML

Β The F2 skip traces in Cesium have looked a bit odd:


Whyyyyy?????

It's because they're starting from sea level, not the altitude of the station.... I think... What follows are somewhat random development notes.

Relative to Ground: True, Alt: 0


Relative to Ground: True, Alt: 3600 meters


Relative to Ground: True, Alt: 1772.717


Almost!!!

Relative to Ground: true, elevation:Β 1770.829467773438


I got the more accurate elevation from the elevation plugin using:
{{ tx_lat }},{{ tx_lng }}|{{ rx_lat }},{{ rx_lng }}


Not quite there yet....
To get this close, I had to run withΒ 


But the CZML schema says:

So, it seems like the correct altitude in this case should be 0. (Start the line on the ground.) But, if I put in zero for altitude, I get the result shown above


Found a reference to quaternions. Ahhhh, quaternions.


References

Ionosonde Data

This was made possible with data collected byΒ 


Cesium Maps Embedded in Datasette for the Ham Radio QSO Logger

Β KO6BTY and I attended office hours with Simon Willison yesterday.


At the very end of our call, Simon showed us how we could open a czml directly from our localhost Datasette server in Cesium. After about an hour this morning, the video below shows the results.

Here's what you're seeing. There's an SQL query in our Datasette instance that grabs only the QSOs from our Cibola National Forest POTA back in March. That query resulted in 9 QSOs shown in the table. Our additional CZML (and now Cesium viewer) plugin creates a CZML map that is loaded into a Cesium Ion viewer at the bottom of the page.

I'm not releasing the code that loads up the viewer quite yet because I have to get the access token squirreled away and all that good stuff. Meanwhile the CZML plugin has been released for a few days now.


By the way, we need a way to pull adif files from POTA activations into Datasette. Keep an eye out :)

Things I Learned: The CZML Interval and Map Animation Time Control

Β I completed the first prototype of my CZML QSO mapping template for Datasette yesterday.

So far, I've implemented animation by using the interval property in CZML. Intervals can be attached to any (?) other tag it seems. I had to intuit what to do on a large degree based on the documentation.

{
    "id": "myObject",
    "someProperty": [
        {
            "interval": "2012-04-30T12:00:00Z/13:00:00Z",
            "number": 5
        },
        {
            "interval": "2012-04-30T13:00:00Z/14:00:00Z",
            "number": 6
        },
    ]
}

I used CZML polylines to display each QSO. Each polyline has a show property. I attached an interval to each QSO of one minute, like so:

.

    "id":"ea1ec",
    "name":"ea1ec",
    "polyline":{
      "positions":{
        "cartographicDegrees":[-106.5569121602622,32.371370471129424,0, -3.689354499999999,42.3504659,0]
      },
      "material":{
        "solidColor":{
          "color":{
            "rgba":[255, 0, 0, 255]
          }
        }
      },
      "show":[
          {
              "interval":"2024-03-14T23:29:00Z/2024-03-14T23:30:00Z",
              "boolean":true
          }
      ],
      
      "width":5,
      "clampToGround":true
    }
  }

The inference that the viewer (happily) made was that if the show property was true in the interval, then it must be false the rest of the time. (The default value of 'show' is true, so I was quite pleased with this implementation instead of the alternative where I might have had to define intervals for when I wanted the line turned off. This solution is far more intuitive to me.

I like several things about how this worked out with Cesium as opposed to other geospatial solutions available on the web. First, Cesium has animation available directly on the web as opposed to a desktop application.Β 


Second, the player controls are available to the user and the player time range is specifiable in the CZML file, like this:

  {
    "id":"document",
    "name":"my first map",
    "version":"1.0",
    "clock":{
      "interval":"2024-03-14T23:28:00Z/2024-03-15T00:00:00Z",
      "currentTime":"2024-03-14T23:24:00Z",
      "multiplier":60,
      "range":"LOOP_STOP",
      "step":"SYSTEM_CLOCK_MULTIPLIER"
    }
  },
  {
    "id":"k6mdg",
    "name":"k6mdg",
    "polyline":{


The "clock" "interval" specifies the entire time available to the player. I need to modify my template a bit to make the beginning of the interval, (which is the time of the QSO at the moment), match the currentTime, (which is a few minutes earlier to provide a runway into the animation.) I suspect this may be what's causing me to have to click the play button twice to start the animation.

The final nice feature I'll point out today is that the Cesium Sandcastle makes it easy to play and experiment with both CZML and using JavaScript to control the viewer. You can even import CZML into Sandcastle sessions using the viewer's load method and statically hosted files. I used github as an easy platform to serve files from. (Keep in mind that new commits to files take about a minute to reach the raw page.)

On the downside, the documentation for CZML took me a while to get used to and required several mental leaps and experiments, some of which were incorrect.Β 

Oh! And it turns out you can share and embed slide shows. I'm not an expert at these yet, but they seem promising.

Things I Learned: CZML animations

Β A single path animation is up and running!

The animation can be seen here.

But wait! There's more! I now have a template that creates an entire animation:


Want to explore it on your own! Please do:


I'll have more details soon. For now, here's the template.

Check out the sun going down over the Organs as the POTA progresses! So Cool!!!


Β NOTE: If you're on a cell phone, first zoom the globe in until you can't see the edges of the Earth. At that point, the terrain should become visible. It appears to be a Cesium issue, but it's easily worked around.


Things I Learned: Cesium Ion and CZML

Β I had a little time to play with a new mapping app over the weekend!

This one is from Cesium and in its native form uses a JSON derivative called CZML. CZML is similar to KML. Furthermore, while it won't animate kml for me (at least not yet), CZML looks like it will support timestamps and animation. So! Maybe there'll be a new plugin for the logging program this week.

Also! The resulting maps are shareable!


And perhaps can be shown in an iframe

❌
❌