via Hackaday: The Apple Watch As An Ammeter
15 September 2024 at 17:45

 |
| Figure 1: Power/VSWR meter using ИН-13 (a.k.a. "IN-13") neon bar-graph indicators. Click on the image for a larger version. |
 |
| Figure 2: A pair of ИН-13 neon indicator tubes. These tubes are slightly longer than than the ИН-9 tubes and have three leads Click on the image for a larger version. |
 |
| Figure 3: Test circuit to determine the suitability of various inductors and transistors and to determine reasonable drive frequencies. Diode "D" is a high-speed, high-voltage diode, "R" can be two 10k 1 watt resistors in parallel and "Q" is a power FET with suitably high voltage ratings (>=200 Volts) and a gate turn-on threshold in the 2-3 volt range so that it is suitable to be driven by 5 volt logic. V+ is from a DC power supply that is variable from at least 5 volts to 10 volts. The square wave drive, from a function generator, was set to output a 0-5 volt waveform to make certain that the chosen FET could be properly driven by a 5 volt logic-level signal from the PIC as evidenced by it not getting perceptibly warm during operation. |
 |
| Figure 4: The voltage boost converter section showing the transistor/inductor, rectification/filtering and voltage divider circuitry. |
 |
| Figure 5: The precision current sinks that drive the neon tubes precisely based on PWM-derived voltage. Click on the image for a larger version. |
 |
| Figure 6: An exterior view of the tandem coupler module. Visible is the top shield and the three feedthrough capacitors used to pass voltage and block RF. Click on the image for a larger version. |
RF sensing
For sensing forward and reflected power I decided to use an external "sensing head" that was connected inline with the radio, on the "tuner" side of the feedline.
For sensing power in both directions I chose the
so-called "Tandem" coupler which consists of a through-line sampler in
which a short length of coaxial cable carrying the transmit power (T1 in the diagram of Figure 7) passes through a toroidal core -
using some of the original cable's braid grounded at just one end as a
Faraday shield. An identical transformer (T2) is connected across the first (T1) for symmetry.
When carefully constructed this arrangement has quite good intrinsic directivity and a wide frequency range. Figure 6 shows the diagram of this section.
 |
| Figure 7: Schematic diagram of the "Tadem" coupler. A bidirectional coupler sends power to separate AD8307 logarithmic amplifiers - one for forward and the other for reverse. The outputs, expressed in "volts/dB" are sent to the microcontroller. Click on the image for a larger version. |
The RF sensing outputs of the second tandem coupler (T2) then goes through resistive voltage dividers (R606/R607 for the reverse sample and R603/604 for the forward sample) to a pair of Analog Devices AD8307 logarithmic amplifiers - one for forward power and the other for reverse - to provide a DC voltage that is logarithmically proportional to the detected RF power. This voltage is then coupled through series resistors (for both RF and DC protection) R605/R608 and to the outside world using feedthrough capacitors.
The use of a logarithmic amplifier precludes the
need to have range switching on power meter as RF energy from well below
a watt to well over 2000 watts can be represented with only a few volts
swing. Looking carefully at Figure 6 one can see a label that notes that the response of the AD8307 is about 25 millivolts per dB - and this applies across the entire power range of a few hundred milliwatts to 2000 watts.
All of this circuitry is mounted in a box constructed of circuit board material and connected to the display unit with an umbilical cable that conveys power and ground along with the voltages that indicates forward and reflected power.
 |
| Figure 8: An inside view of the Tandem Match (sense unit) showing the coupling lines, internal shielding and AD8307 boards. Click on the image for a larger version. |
The AD8307 detectors themselves can be seen at the left and right edges of the lower half of the unit, built on small pieces of perfboard. All signals - including the 12 volt power and the DC voltages of the output pass through 4000pF feedthrough capacitors to prevent both ingress and egress of RF energy which could find its way into the '8307 detectors and skew readings.
* * * * *
In a future posting (Part 2) we'll talk about the final design and integration of this project.
This page stolen from ka7oei.blogspot.com
[END]
![]()
The Chameleon SA-1 is a compact easy to use antenna analyzer that will help you measure SWR and tune your multi band antenna, like the Chameleon PRV System or Wolf River Coil Silver Bullet 1000. The meter measures SWR from 1:1 – 19.9 in a frequency range of 1.6 MHz to 160 MHz.
Chameleon CHA SA-1 SWR Analyzer https://chameleonantenna.com/shop-here/ols/products/cha-sa1-analyzer
Chameleon PRV POTA Heavy Kit: https://chameleonantenna.com/shop-here/ols/products/cha-mcc/v/CHA-MCC-PRV-POTA
4 foot step in fence post, black: https://www.menards.com/main/building-materials/fencing/utility-fencing/4-step-in-post/1711970/p-1571898510584-c-5768.htm
Letotech TTL to USB Serial Converter: https://amzn.to/4a9Kbh9
Tripod Quick Release Plate: https://amzn.to/3IBaAJI
Chameleon 3/8 to 1/4 inch thread tripod adapter: https://chameleonantenna.com/shop-here/ols/products/cha-tripod-adapter
Bogen 3001 Tripod Legs – no longer produced
The Chameleon SA-1 is a compact lightweight SWR analyzer that would be perfect in your portable antenna kit. Opening the box you will find, a Nine volt battery, a BNC to UHF adapter, and the unit itself enclosed in a protective velvet bag.
The SA-1 has a continuous frequency range of 1.6 to 160 Mhz so it will be able to test the SWR for anyHF and VHF antennas in the amateur radio bands. It can also display the SWR from 1:1 up to 19.9:1 for that antenna. Run time with the battery is approximately 20 hours or 15 hours when you use the back light.
On the top of the meter is a small power switch, a BNC antenna port, and a socket that is labeled serial. We’ll talk about the serial feature in a bit. But first let’s look at the front of the unit
The SA-1 does not come with any instructions. Instead, everything you need to know to operate the meter is screen printed on the front of the unit. When you power on the meter, you will see the frequency and SWR on the dot matrix LCD display. Every time you turn on the unit, the frequency also defaults back to 14,000 Mhz. To adjust the frequency, you first tap the knob to select the digit and then rotate it to change the number. The unit is constantly testing the SWR, so there is nothing else you need to do. If you want to toggle the backlight, press and hold the center knob. That’s it. The SA-1 does one thing, and that’s measuring SWR. so there is nothing else you need to set it up.
A single function meter like this can be really handy in the field as it doesn’t distract with unnecessary features. It’s all in the goal of getting on the air quickly. So let’s see how fast we can do that as I demonstrate setting up and adjusting a multiband vertical antenna.
Timestamp
00:00:00 Chameleon SA-1 Antenna Analyzer
00:01:35 Features and Specs of the Chameleon SA-1
00:03:31 Using the SA-1 SWR Meter
00:13:15 Chameleon SA-1 Secret Feature
00:15:30 My thoughts on the SA-1 Antenna Analyzer
Links may be affiliate links. As an Amazon Associate, I earn from qualifying purchases. This does not affect the price you pay.
Like what you see? You can leave me a tip:
https://www.paypal.me/kb9vbr
The post The Fastest Antenna Analyzer: Chameleon SA-1 SWR Meter appeared first on KB9VBR Antennas.
This was a little rabbit hole. On some amateur radio forum somewhere someone mentioned the MFJ-802B RF Field Strength Meter. This piqued my interest because I had not realized that a field strength meter was a consumer accessible device. Turns out there are all sorts of RF meters and detectors available to purchase. Who knew?
This collided me into the homebrew versions of RF detectors. One that caught my eye, and inspired this project was “The Squeakie” by VK3YE. It requires a handful of components, all of which I had. I built it mostly to spec on a breadboard, adding only an extra trimpot to control the volume. Then I soldered it onto perfboard and it, after a bit of troubleshooting, worked exactly as advertised. In short, it squeaks at a proportionally higher pitch when it encounters radio waves. This means it is useful as an audible RF field strength meter. You could use it to detect RF while fox-hunting, or to test the radiation pattern of an antenna, or to annoy your significant others… In short, it is a voltage-controlled oscillator that increases in frequency in the presence of an RF signal.
So I built The Squeakie, and sure enough one tap on my HT, and the little guy was shrieking. Below gives you a rough sketch of how I positioned and connected everything. This perfboard is of the type that all of the holes in each individual row are interconnected (and represented by the printed lines on the page).
So how exactly does The Squeakie work? My modification of VK3YE’s Field Strength meter is shown in part below (circuit constructed with Multisim).
Let’s start with D1, which is the switching diode 1N4148. In this application, the diode is acting as a rectifier, transforming an RF signal coming from the antenna into direct current.
Next let’s discuss the 555 Timer IC. This circuit is set up in “astable” mode, which means that the 555 timer is going to oscillate between an output of VCC and zero volts indefinitely with a regular and predictable voltage-dependent frequency. The tying of the threshold (pin 6) and trigger (pin 2) together puts the 555 in a permanently unstable state flipping between “on” (with a voltage equivalent to that seen on pin 8, i.e. VCC) and “off” (zero voltage) producing an endless square wave.
Resistors R1 and R2, along with capacitor C3 work together to produce the frequency of the 555 Timer output. In the situation where VCC is the only voltage source, the threshold/trigger flip-flop produces a stable oscillation. But in our circuit, the antenna acts as an additional voltage source in the presence of RF, adding to the VCC, and resulting in more swift oscillations (i.e., an increase in frequency of the output square wave signal).
The VCC crosses the R5 resistor, 20kΩ potentiometer, and the R4 resistor , which act as an adjustable voltage divider, creating a forward bias on the 1N4148 diode. The 20k POT can be adjusted to increase or decrease the voltage either toward the diode or toward ground, and in turn, change the frequency of the timer output. An additional voltage supplied by the antenna and rectified by the diode will increase that frequency.
The output voltage, rhythmically oscillating between VCC and zero volts, will cross through an electrolytic capacitor and to an 8Ω 0.5W loudspeaker whose volume is controlled by a 200Ω potentiometer. Running in parallel to the loudspeaker is also an LED that’s brightness will be increased or decreased with the frequency (and duty cycle) of the timer. And also an output lead to provide a readable input to a microcontroller is also available. In this case I used an Arduino Nano as well as a 1602 LCD screen.
The above EasyEDA schematic shows my entire finalized project. Or I supposed at least version 1.0. This includes placement of a DPDT switch (SW1) to switch from the Nano to the loudspeaker. A second switch (SW2) to switch the output to the Nano on or off. Three 2-port terminal blocks for the voltage source, antenna, and loudspeaker. The Arduino Nano and it’s connections to the 1602 LCD screen. And finally, the code I programmed for the Nano that would convert the output reading of the RF meter into a corresponding number. I’ll talk more about the code later on.
Below shows the entire breadboarded project, fully operational. In my version, not only does it squeak in higher frequencies (and have an adjustable volume) in the presence of RF above ambient background noise, it also brightens an LED proportional to RF signal strength, and displays a relative numerical meter reading. The antenna is just a length of wire tied into the positive port of the terminal block.
And just a close-up of the placement of the components. You will notice that the readout number is much less bright than the words “RF Strength”. I think this is due to the very quick oscillations of the device, of which I tried to account for somewhat in my rudimentary code. Hey, what can I say? It needs work.
I did go ahead and convert my EasyEDA schematic into a PCB through JLCPCB. Remember, I do not accept sponsorship from anyone. I actually cannot believe how easy it is to acquire a circuit board from this company.
The unpopulated rendering of the PCB is shown below. And the partially populated board is above.
And an exact Bill of Materials below.
And finally the code!
#include <LiquidCrystal.h>

int rs=7;
int en=8;
int d4=9;
int d5=10;
int d6=11;
int d7=12;
LiquidCrystal lcd(rs,en,d4,d5,d6,d7);

int maxVal = 0;
uint32_t lastSample = 0;

void setup() {
  Serial.begin(9600);
  lcd.begin(16,2);

}

void loop() {

    if (millis() - lastSample > 1000) {
        lastSample = millis();
        Serial.println(maxVal);
        maxVal = 0;

    }
    int reading = analogRead(1);
    if (reading > maxVal) {
        maxVal = reading;
    }
        lcd.setCursor(0,0);
        lcd.print("RF Strength: ");
        lcd.print(maxVal);
        lcd.clear();


}


What can I say? The firmware sure isn't pretty, and it doesn't even give you great results. But it does kinda work. I will probably spend some time working out different ways to produce more meaningful results from the readable Nano lead of this device.
This was a great and instructive project to work through for me. It also lends itself to a really easy soldering project for hams, or students, or individuals, particularly if you only build the part with the loudspeaker, or even the original “The Squeakie”. I think it is putting me one step closer to building my own receiver, which is something I have made a few attempts at so far.
May we meet again!
KM1NDY
Some years ago, I purchased and assembled an Oak Hills Research WM-2 QRP Wattmeter from Milestone Technologies. As far as QRP wattmeter kits go, it was something of a classic at the time, and as such, I wanted one. I’m glad I made this purchase, as they are no longer available – at least, in this form. Another company is offering a very similar kit, but without the decals on the case. I was told that they acquired the rights to it from Milestone Technologies, so this would be appear to be a direct clone of the WM-2. The WM-2 is a great little wattmeter, with 3 ranges representing 100mW, 1W, and 10W full-scale – an ideal selection of ranges for the QRPer. You can read both forward and reflected power. While direct readout of SWR is not offered, it can be calculated from the forward and reverse power readings. The WM-2 has an analog meter and can be left inline while operating. Apart from the satisfaction of being able to see the needle bob up and down when transmitting, this type of indicator is very useful when peaking circuits for maximum output. It can certainly be done with a digital readout, but an extra stage of “translation” needs to happen in the brain, converting the number on the readout to a “level”. This process when looking at an analog meter is more immediately intuitive.
That was so many photos of my WM-2, that you might be thinking, “Hang on – isn’t this a post about the QRPoMeter? Well, it is – and we’ll get to that very soon. I don’t think I ever blogged about the WM-2 when I built mine years ago, so felt it was time to give it some air time on my blog.
For my purposes, the WM-2 meets my needs. However, I don’t have any other instruments with which to check the accuracy of it’s readings. A Bird wattmeter would be nice, but the expenditure is hard to justify. Another option is to use an oscilloscope to measure the peak to peak voltage a transmitter develops across a 50 ohm dummy load, and use that to calculate power. This is a definite possibility in the future, as I do intend to add a digital storage oscilloscope to the shack at some point. In the meantime, it would be good just to have another wattmeter of similar accuracy, simply to increase my confidence in the readings I am getting from either one. For the kind of operating us QRPers do, absolute accuracy is not essential. 5% of full scale is good enough which, on a 10W scale, means ±0.5W. If I claim to be transmitting with 5W, then the difference between 4.5 and 5.5 W is unlikely to even be noticed at the receiving end.
The QRPoMeter, designed by Dave Cripe NM0S, has been on my radar for a very long time. Originally offered by the 4SQRP group, it is a very affordable instrument for measuring power and SWR. It has a built-in dummy load, to make measuring the power into a 50 ohm load an easy task. Also, when measuring SWR, it uses a resistive bridge, so that the maximum SWR your transmitter will see is 2:1. I’ve long wanted to assemble this kit. A few times, I’ve waited too long to purchase a kit, only to find that it was no longer available (the SST, once offered by Wilderness Radio, was one example). With that in mind, and also because the QRPoMeter is so reasonably priced, I went ahead and placed an order with NM0S Electronics.
A few days later it arrived, in a small flat rate Priority Mail box. I love getting radio parts and kits in the mail. It’s exciting! The PCB pieces that, as well as forming the circuit board, also comprise the case, were slipped in between pages of the assembly manual to protect them. There was also a little bag of goodies. I love little bags of radio parts!
The bag of parts, emptied out into a styrofoam tray –
Also included was a piece of thin 2″ x 3.5″ PCB material, etched and silkscreened on both sides. On one side was the business card of NM0S Electronics. On the other side were these handy little band plans –
The pieces that form the sides of the case have to be broken off from the larger pieces of PCB material, and given a very light filing to remove the rough edges. It was immediately obvious how smart the final product was going to look. It was raining very, very lightly when I took this photo. If you look carefully, you might see some very small raindrops on the panels –
For anyone who has assembled a few kits, construction is uncomplicated. Dave’s instructions are clear and straightforward, consisting mainly of a checklist for populating the board, and instructions for constructing the included PCB case. The switches and input/output BNC connectors are all mounted directly on the board. The only wiring required is a 4-conductor ribbon cable that is used for the connections between the board and the LCD panel meter. Other than wiring up this meter, and soldering the case pieces together, construction of the QRPoMeter consists of populating the single PCB with the parts. This picture is of the finished board before the two switches were installed –
I only discovered two very slight issues during assembly. Neither will present a problem for anyone with a little experience, but they might slightly confuse a beginner. These were due to a change in sourcing parts, and Dave said he will take care of them in future versions of the construction manual. These were –
2. When using the 4-conductor ribbon cable to connect the LCD panel meter to the board, because the instructions refer to an earlier version of the meter, a beginner might experience some uncertainty as to which holes on the meter board to connect to which holes on the main board. On the main board, there are two pads next to each other marked +Vin and -Vin. These are connected to the pads on the meter board that are marked “IN” and “COM” respectively. The other two connections are more obvious. The pads on the main board, next to the schematic symbol for a 9V battery, marked + and -, are connected to the pads on the back of the meter board, next to the “DC 9V” text, that are marked + and respectively.
A portion of the board in greater detail, showing the 8 large surface mount resistors that form the dummy load/resistive bridge (or, to be more accurate, 7 of them, and a small part of the remaining one) –
Calibration is straightforward, and requires a fairly accurate DMM. I used my Brymen BM235 (the EEV Blog version). The only other piece of equipment needed is any HF QRP transmitter with an output of between 2 and 10 watts. The output power doesn’t need to be known, as long as it falls within that range. When the unit is calibrated, you have a very handsome and useful piece of QRP kit!
The QRPoMeter seems to be accurate enough for my purposes. Power measurements are in line with the ones reported by my WM-2, taking into account the accuracies of both instruments. SWR measurements are similar at the lower readings. They differ by fairly large amounts at higher SWR’s. This doesn’t concern me though, as once the SWR goes much above 2 or 3:1, it’s exact value is of little interest to me. I just know that I want to get it back down below 2:1! A useful feature of the resistive bridge in the QRPoMeter that is used to measure the values of forward and reflected power, is that when SWR is being measured, the transmitter never sees an SWR higher than 2:1. This was verified with the SWR indicator in my Elecraft K2.
Thanks Dave. A good-looking and worthy little piece of QRP test gear! The QRPoMeter is available from NM0S Electronics.
![]()
![]()
 |
| Er staan 4 gebouwen in het radiopad tussen PA1X boven en PA1B beneden |
![]()
As title says; a simple capacitance meter.
One youtube video by VK3YE was enough to get me started building, after all, the meter that I was using before was not behaving correctly (latter found the problem).
The outcome was this:

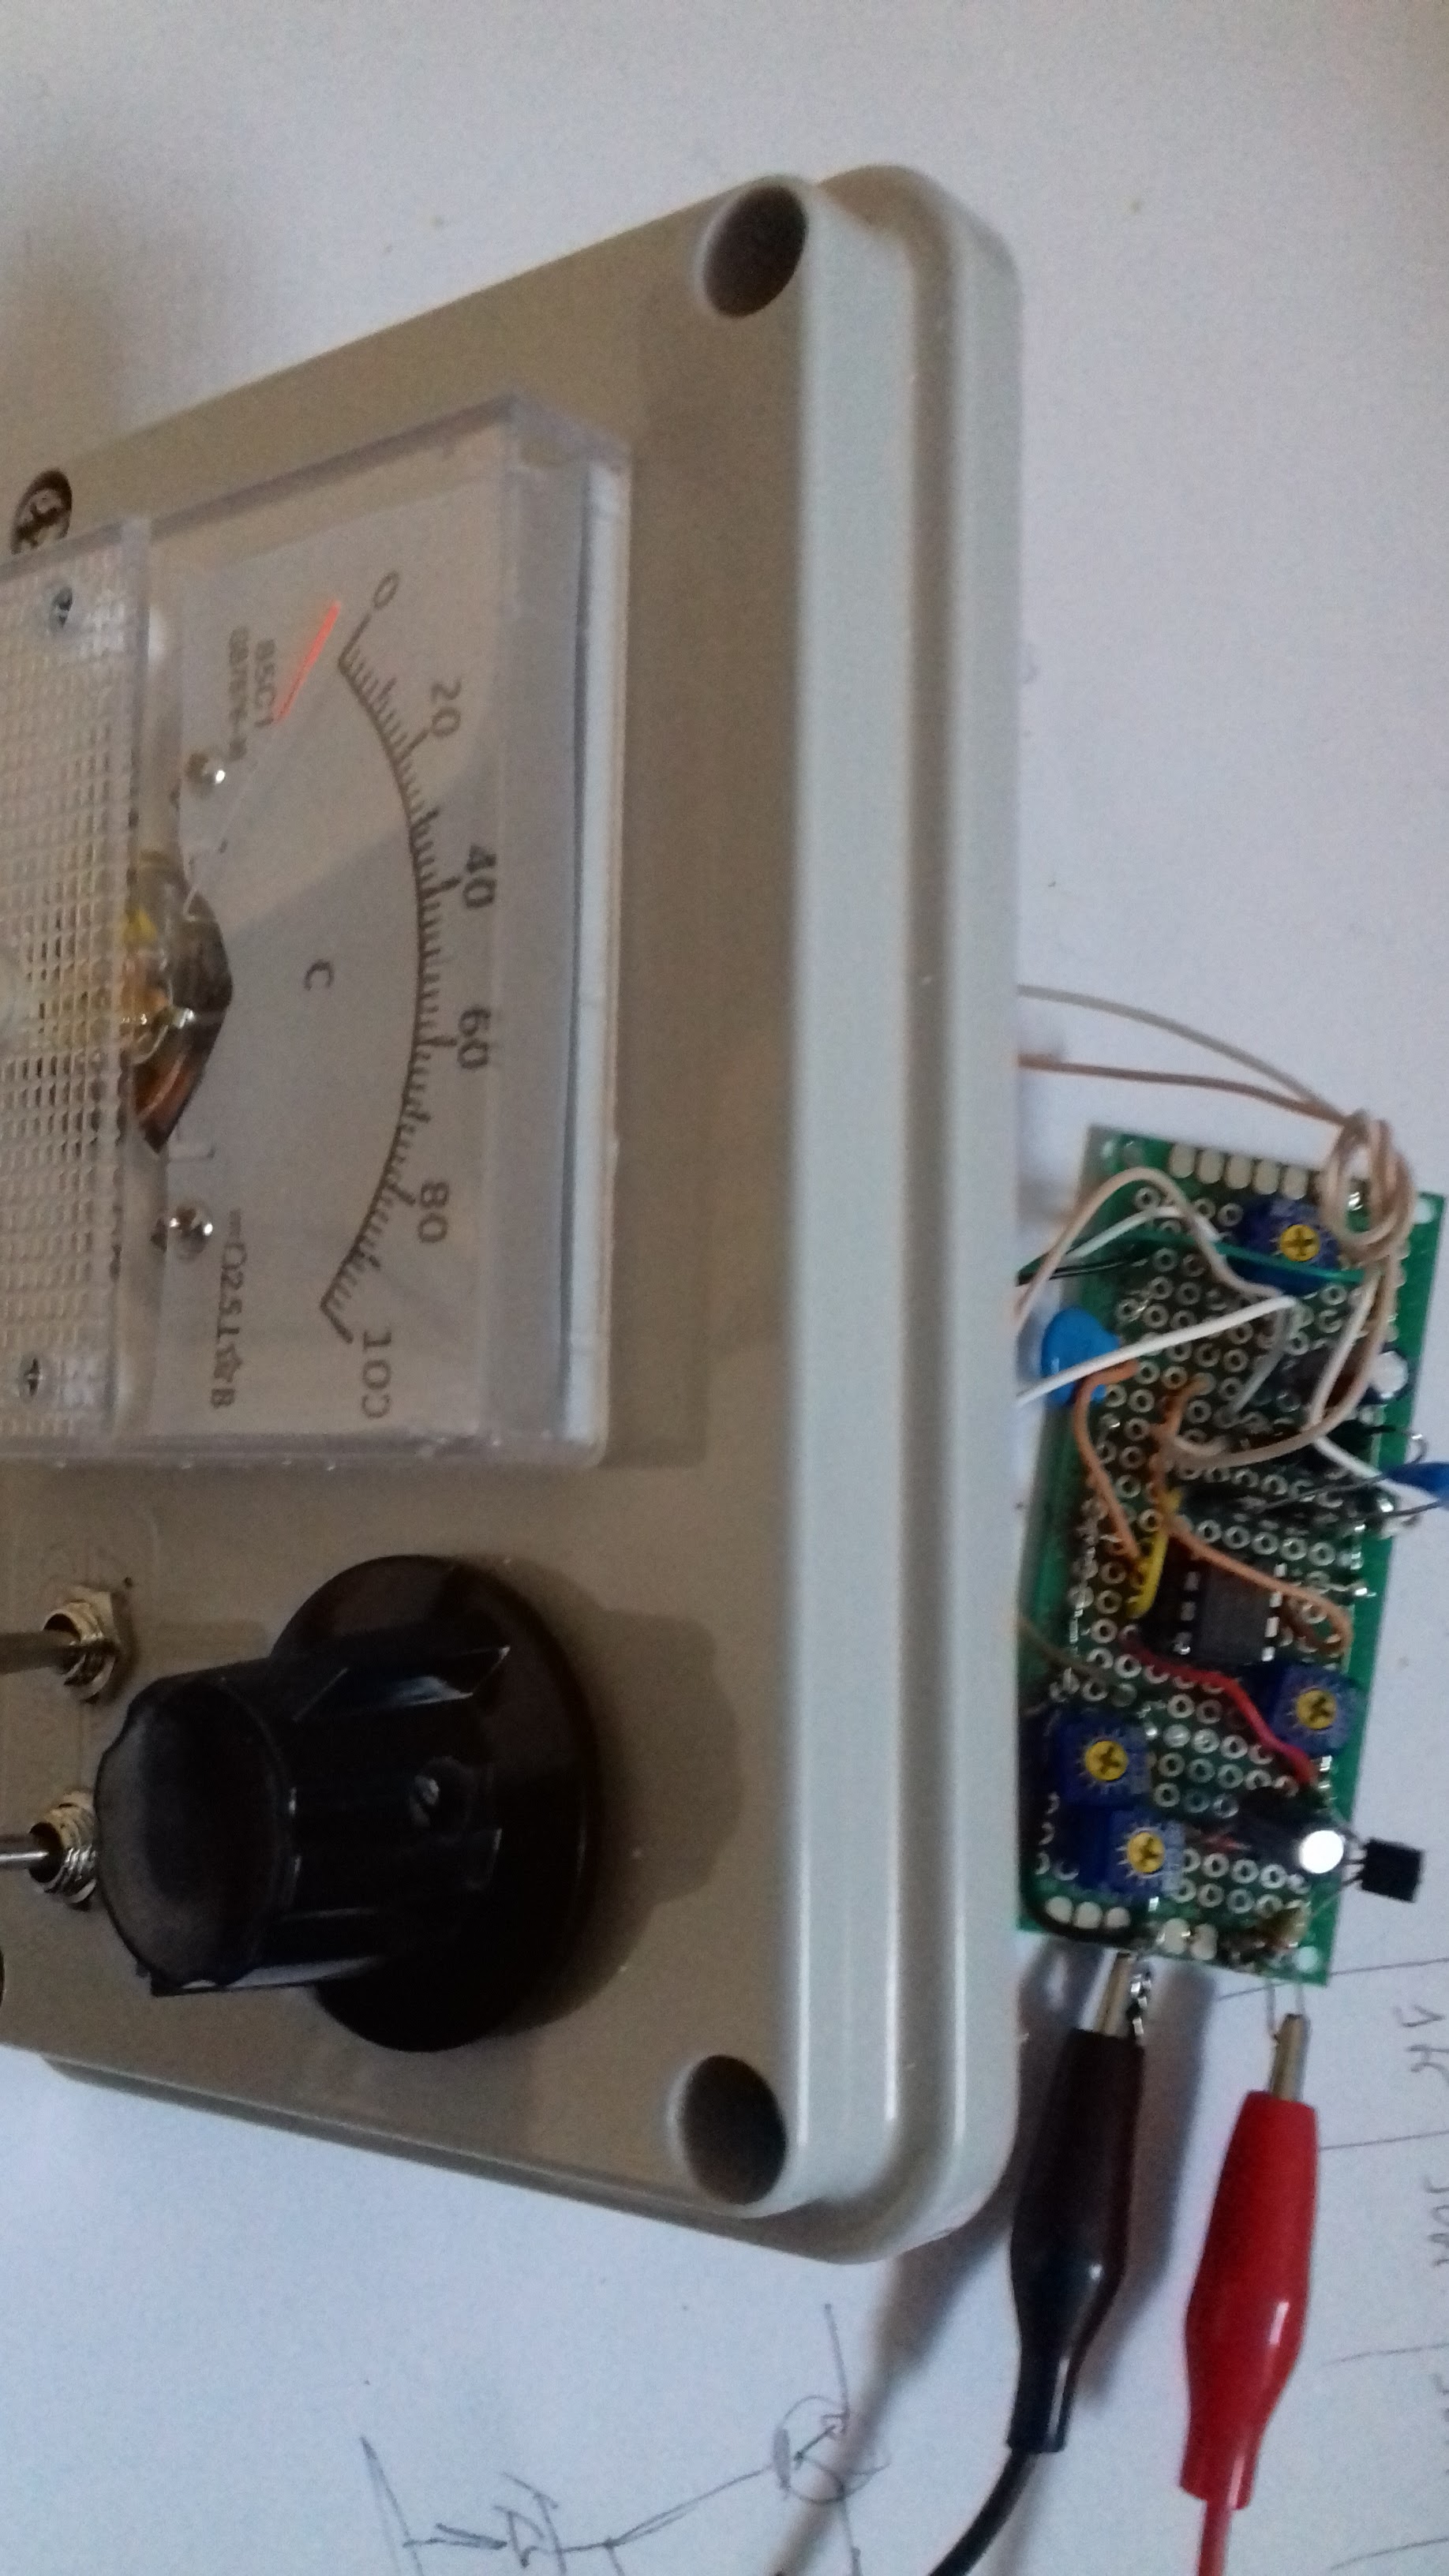


To calibrate I used a 68pF and 27pF capacitor, the idea was not to have highest precision possible only to be in a position of having certain about unmarked capacitors.
Some description/schematic from here and here:

I used different Ge diodes and the 10K pot was changed for 2 of 5K in series to give better adjustment range. The Zener was changed to 6.8v.
Ranges like this:
E: 100pF
D: 1nF
C: 10nF
B: 100nF
A: 1uF
Have a nice day!
![]()
If one owns a receiver with a waterfall display, the increased cluttering of the 12 and 10 meter bands with weird "swooping" signals could not have gone unnoticed. Take, for example, this recent snapshot of the lower portion of 10 meters from the waterfall of WebSDR #5 at the Northern Utah WebSDR (Link)
 |
| Figure 1: 10 Meters as seen on a beam antenna pointed toward Asia showing QRM from a large number of different sources - presumably dielectric heaters/welders/seamers. These things radiate badly enough that they should have their own callsigns, right? Click on the image for a larger version. |
In looking at this spectral plot - which comes from an antenna oriented to the Northwest (toward Asia and the Pacific) one could be forgiven for presuming that someone had somehow connected a can of "Silly String" to their coax and was squirting noodles into the ionosphere!
What, specifically, are we looking at?
Across the entire spectrum plot one can see these "curved" signals, some of them - like that near the bottom, just above the cursor at 28374 kHz - are quite strong while there are many, many others that are much weaker, cluttering the background. These signals contrast with normal SSB and CW signals - the former being seen clustered around 28500 and the latter around 28100 kHz - which are more or less straight lines as these represent transmissions with stable frequencies.
What are these from? The general consensus is that these are from "ISM" (Industrial, Scientific and Medial) devices that nominally operate around 26957 kHz to 27283 kHz. Clearly, the waterfall plot shows many devices outside this frequency range.
What sort of devices are these? Typically they are used for RF heating - most often for dielectric sealers of plastic items such as bags, blister packs - but they could also be used in the manufacture of items that require some sort of energetic plasma (e.g. sputtering metal, etching) in any number of industrial processes.
Where are they coming from?
The simple answer is "everywhere" - but in terms of sheer number of devices, it's more likely that much of the clutter on these bands originates in Asia. Consider the above spectral plot from an antenna located in Utah pointed at Asia - but then consider the plot below, taken at about the same time from an antenna that is pointed east, across the continental U.S. and Canada - WebSDR #4 at the Northern Utah WebSDR (link):
 |
| Figure 2: 10 Meters on a beam pointed toward the U.S. Click on the image for a larger version. |
To be absolutely fair, this was taken as the 10 meter band was starting to close across the U.S, but it shows the very dramatic difference between the two antenna's directionality, hinting at a geographical locus for many of these signals.
Further proof of the overseas origin of these signals can be seen in the following plot:
 |
| Figure 3: Spectrum from AM demodulation of some of the signals of Figure 1 showing 50/100 Hz mains energy. Click on the image for a larger version. |
This plot was taken by setting the WebSDR to AM and setting for maximum bandwidth, tuning onto a frequency where several of these "swoops" seen in Figures 1 and 2 are recurring and then, using a virtual audio cable, feeding the result directly into the "Spectran" program (link).
As expected this plot shows a bit of energy at the mains harmonic frequencies of 120, 240 and 360 Hz owing to the fact that this antenna points into slightly-noisy power lines operating at the North American 60 Hz frequency - but on this plot you can also see energy at 50 and 100 Hz, indicative of a lightly-filtered power supply operating from 50 Hz power mains - something that is NOT present anywhere in North America.
Based on other reports (IARU "Intruder Watch", etc.) a lot of these devices seem to be located in Asia - namely China and surrounding countries where one is more likely to experience lax enforcement of spurious radiation of equipment that is manufactured/sold in those locales.
Why the "swoop", "curve" or "fishook" appearance seen in Figure 1? If these devices were crystal controlled and confined to the nominal 26957 kHz to 27283 kHz ISM frequency range, we probably wouldn't see them in the 10 meter amateur band at all, but many of these devices - likely "built to cost" simply use free-running L/C oscillators that are accurate to within 10-15% or so: As these oscillators - which are likely integral to the power amplifier itself (perhaps self-excited) - warm up, and as the industrial processes itself proceeds (e.g. plastic melts, material cures, glue dries) the loading on the RF output of this device will certainly change, and this results in an unstable frequency.
Why do they radiate?
Ideally, the RF would be contained to the working area and in the past, reputable manufacturers of such equipment would employ shielding of the equipment and filtering of power and control leads to confine the RF within. But again, such equipment is often "built to cost" and such filtering and shielding - which is not necessary for the device to merely function is often omitted.
Can we find and fix these?
In this U.S. and parts of Europe such sources are occasionally tracked down and RF interference mitigated - either voluntarily or with "help" from the local regulator - but the simple fact is that the intermittent nature of these sources - and the fact that they radiate on frequencies that are prone to good propagation when the sun is favorable to such - makes them very difficult to localize. If the signal source is coming from halfway around the world, there's likely nothing that you can do other than point your directional antenna the other way!
If it so-happens that you can hear such a signal at your location at all times of the day - regardless of propagation - you may be in luck: There may be a device with a short distance (a few miles/km) of your location - and perhaps you can make a visit and help them solve the problem.
* * * * * * *
Related article:
This page stolen from ka7oei.blogspot.com
[End]
![]()
Small project made last year (4 days ago) just for fun and to try out the SWR feature of the spectrum analyzer.
Design is based on this one to the exception of the ferrite material, I used 43 instead of 77.

Build:


With no load connected in one direction and then the opposite one (cable swap), if all is perfectly balanced it should show equal lines, in this case....almost there, in any case the return loss line is all but flat...


Now measuring a 50 Ohm load, ideally should give the lowest possible result and a flat line for all the frequency range:
At 1.6Mhz: 1.22, so not very usable at the low range, probably due to lack of inductance on the core.

At 10.8 Mhz, 1.05, much more inline with and expected result (very low VSWR).

At 152 Mhz looks like it starts to break the measurement again.

And forget it at 433 Mhz since it's too off.

The load used was a Narda 370 BNM, 5W and good to 18Ghz.
Basically it's very usable on the HF range or just as general curve tracer for antenna VSWR at VHF frequency ranges.
You can also take the same info without the SWR measurement option on the Spectrum Analyzer, just use the tracking generator, normalize in the open position (no device under testing connected) and then look for the SWR from the return loss measured, you can use this table or calculate it yourself.
Have a great Year!
![]()