Vandaag viel het Electron van de VERON op de deurmat met daarin de uitslag van de 39ste Friese elfstedencontest. Ook heel leuk dat ze het artikel van mijn website hebben overgenomen om te plaatsen ( dit artikel ). Dit jaar hebben wij ( Dion PE1ORG en ik ) de 22ste plek behaald en dat is best een goede score. Meedoen is ook zeker belangrijker dan winnen voor ons.
Of het volgend jaar gaat lukken om vanaf deze locatie weer mee te doen met de contest is afwachten. De storing waar ik over schreef en waarvan ik heel blij was dat deze is verdwenen, is weer terug. Helaas…. Toch het RDI maar weer eens uitnodigen.
De volgende (veertigste) Friese elfstedencontest is op zondag 17 november 2024. Alle informatie over deze contest vind je hier: http://www.pi4lwd.nl/11stindex.htm
Alle verslagen van de eerdere deelnames aan de Friese Elfstedencontesten vind je hier
Some years ago, I purchased and assembled an Oak Hills Research WM-2 QRP Wattmeter from Milestone Technologies. As far as QRP wattmeter kits go, it was something of a classic at the time, and as such, I wanted one. I’m glad I made this purchase, as they are no longer available – at least, in this form. Another company is offering a very similar kit, but without the decals on the case. I was told that they acquired the rights to it from Milestone Technologies, so this would be appear to be a direct clone of the WM-2. The WM-2 is a great little wattmeter, with 3 ranges representing 100mW, 1W, and 10W full-scale – an ideal selection of ranges for the QRPer. You can read both forward and reflected power. While direct readout of SWR is not offered, it can be calculated from the forward and reverse power readings. The WM-2 has an analog meter and can be left inline while operating. Apart from the satisfaction of being able to see the needle bob up and down when transmitting, this type of indicator is very useful when peaking circuits for maximum output. It can certainly be done with a digital readout, but an extra stage of “translation” needs to happen in the brain, converting the number on the readout to a “level”. This process when looking at an analog meter is more immediately intuitive.
My trusty OHR WM-2 Wattmeter has served me faithfully for years – and continues to do so.
That was so many photos of my WM-2, that you might be thinking, “Hang on – isn’t this a post about the QRPoMeter? Well, it is – and we’ll get to that very soon. I don’t think I ever blogged about the WM-2 when I built mine years ago, so felt it was time to give it some air time on my blog.
For my purposes, the WM-2 meets my needs. However, I don’t have any other instruments with which to check the accuracy of it’s readings. A Bird wattmeter would be nice, but the expenditure is hard to justify. Another option is to use an oscilloscope to measure the peak to peak voltage a transmitter develops across a 50 ohm dummy load, and use that to calculate power. This is a definite possibility in the future, as I do intend to add a digital storage oscilloscope to the shack at some point. In the meantime, it would be good just to have another wattmeter of similar accuracy, simply to increase my confidence in the readings I am getting from either one. For the kind of operating us QRPers do, absolute accuracy is not essential. 5% of full scale is good enough which, on a 10W scale, means ±0.5W. If I claim to be transmitting with 5W, then the difference between 4.5 and 5.5 W is unlikely to even be noticed at the receiving end.
The QRPoMeter, designed by Dave Cripe NM0S, has been on my radar for a very long time. Originally offered by the 4SQRP group, it is a very affordable instrument for measuring power and SWR. It has a built-in dummy load, to make measuring the power into a 50 ohm load an easy task. Also, when measuring SWR, it uses a resistive bridge, so that the maximum SWR your transmitter will see is 2:1. I’ve long wanted to assemble this kit. A few times, I’ve waited too long to purchase a kit, only to find that it was no longer available (the SST, once offered by Wilderness Radio, was one example). With that in mind, and also because the QRPoMeter is so reasonably priced, I went ahead and placed an order with NM0S Electronics.
A few days later it arrived, in a small flat rate Priority Mail box. I love getting radio parts and kits in the mail. It’s exciting! The PCB pieces that, as well as forming the circuit board, also comprise the case, were slipped in between pages of the assembly manual to protect them. There was also a little bag of goodies. I love little bags of radio parts!
The bag of parts, emptied out into a styrofoam tray –
Also included was a piece of thin 2″ x 3.5″ PCB material, etched and silkscreened on both sides. On one side was the business card of NM0S Electronics. On the other side were these handy little band plans –
The pieces that form the sides of the case have to be broken off from the larger pieces of PCB material, and given a very light filing to remove the rough edges. It was immediately obvious how smart the final product was going to look. It was raining very, very lightly when I took this photo. If you look carefully, you might see some very small raindrops on the panels –
For anyone who has assembled a few kits, construction is uncomplicated. Dave’s instructions are clear and straightforward, consisting mainly of a checklist for populating the board, and instructions for constructing the included PCB case. The switches and input/output BNC connectors are all mounted directly on the board. The only wiring required is a 4-conductor ribbon cable that is used for the connections between the board and the LCD panel meter. Other than wiring up this meter, and soldering the case pieces together, construction of the QRPoMeter consists of populating the single PCB with the parts. This picture is of the finished board before the two switches were installed –
I only discovered two very slight issues during assembly. Neither will present a problem for anyone with a little experience, but they might slightly confuse a beginner. These were due to a change in sourcing parts, and Dave said he will take care of them in future versions of the construction manual. These were –
U4, the TLC2272, had no dot or u-shaped indentation to denote the correct orientation. I used the printing of the device number on the top of the IC as a guide instead, and this turned out to be right. See picture below, with U4 circled in red –
2. When using the 4-conductor ribbon cable to connect the LCD panel meter to the board, because the instructions refer to an earlier version of the meter, a beginner might experience some uncertainty as to which holes on the meter board to connect to which holes on the main board. On the main board, there are two pads next to each other marked +Vin and -Vin. These are connected to the pads on the meter board that are marked “IN” and “COM” respectively. The other two connections are more obvious. The pads on the main board, next to the schematic symbol for a 9V battery, marked + and -, are connected to the pads on the back of the meter board, next to the “DC 9V” text, that are marked + and respectively.
A portion of the board in greater detail, showing the 8 large surface mount resistors that form the dummy load/resistive bridge (or, to be more accurate, 7 of them, and a small part of the remaining one) –
Calibration is straightforward, and requires a fairly accurate DMM. I used my Brymen BM235 (the EEV Blog version). The only other piece of equipment needed is any HF QRP transmitter with an output of between 2 and 10 watts. The output power doesn’t need to be known, as long as it falls within that range. When the unit is calibrated, you have a very handsome and useful piece of QRP kit!
The QRPoMeter seems to be accurate enough for my purposes. Power measurements are in line with the ones reported by my WM-2, taking into account the accuracies of both instruments. SWR measurements are similar at the lower readings. They differ by fairly large amounts at higher SWR’s. This doesn’t concern me though, as once the SWR goes much above 2 or 3:1, it’s exact value is of little interest to me. I just know that I want to get it back down below 2:1! A useful feature of the resistive bridge in the QRPoMeter that is used to measure the values of forward and reflected power, is that when SWR is being measured, the transmitter never sees an SWR higher than 2:1. This was verified with the SWR indicator in my Elecraft K2.
Op 19 november 2023 gelukkig weer mee kunnen doen aan de Friese elfstedencontest. Vorig jaar 2022 lukte niet door extreem toegenomen storing op 80 meter die gelukkig sinds een maand spontaan verdwenen is…. En dit jaar ook weer samen met Dion PE1ORG. Sinds 2019 dit ook niet meer samen kunnen doen vanwege Corona. Nu dus wel weer en het was super gezellig en leuk! We hebben weer lekker actief meegedaan, dus zelf CQ roepen en reageren op de CQ-roepende stations. Dit jaar alleen op 80 meter. Aangezien het eerdere jaren altijd erg moeizaam ging op 2 meter hebben we dat voor dit jaar laten rusten en alleen op 80 meter meegedaan. Dion bediende de microfoon en ik het toetsenbord. Werkte super zo. Net een echt conteststation haha… Ondanks de wat tegenvallende condities hebben we in totaal 31 verbindingen op 80 meter kunnen loggen, waarvan 6 multipiers.
Totaal waren er 12 elfsteden stations actief (de multipliers). 11 steden en 1 klunplaats: Leeuwarden, Sneek, IJlst, Sloten, Staveren, Hindelopen, Workum, Bolsward, Harlingen, Franeker en Dokkum. Klunplaats: Bartlehiem.
Op 80 meter ging het best goed. Wel varieerden de signalen erg waardoor sommige stations ver in de ruis en niet verstaanbaar waren, even later S9 + 5dB werden. Door de korte HyEndFed antenne (15 meter lengte) blijft het lastig. Een mooie dipool zou ongetwijfeld beter werken. Helaas ontbreekt de ruimte hiervoor.
Tijdens deze contest ook weer RUMlogNG kunnen gebruiken. Het logboek programma dat ik al een aantal jaren op de iMac gebruik. Thomas (DL2RUM) heeft speciaal voor mij (en uiteraard wie het nog meer wil gebruiken) de Friese elfstedencontest toegevoegd aan RUMlogNG! Dit logboekprogramma (en andere handige apps) vind je hier: https://dl2rum.de/
De erwtensoep met rookworst en stokbrood van de XYL was in ieder geval weer erg lekker en wederom goed verzorgd dit jaar. Ook dat blijft een terugkerende traditie!
Volgende Friese elfstedencontest is op zondag 17 november 2024. Alle informatie over deze contest vind je hier: http://www.pi4lwd.nl/11stindex.htm
The Moxon is an 2 element Yagi style antenna that boasts of a low takeoff angle and high front/back signal to noise ratio. The 15 meter Black Widow Moxon is an excellent antenna for Field Day or other events were a lightweight, portable antenna is ideal. Follow along as I build a Moxon antenna out of fishing poles and other common parts.
My feelings are that 15 meters is going to be the strong band for this year’s ARRL Field Day and I wanted an antenna that could really exploit the band’s capability. Living in the Upper Midwest, using a directional antenna will greatly enhance my signal as I aim it towards either the east or west coast. So let’s discuss what a Moxon antenna is and then I’ll show you how to build your own 15 meter Black Widow antenna.
The Moxon is named after its creator Les Moxon, G6XN. It is best described as a rectangular two element Yagi antenna. I said rectangular as the ends of the driven element and the reflector are folded inwards, which reduces the amount of space it occupies, about 70% of the space of an equivalent dipole antenna. If you add lightweight spanners to the rectangle, you can rotate the antenna.
Typically, the Moxon has about 2db of forward gain, but it also exhibits a high front to back ratio of up to 9dB, depending on height and band. Moxons are easy to build and highly effective on 6 and 2 meters, I’ve previously built a 6 meter Moxon and have the plans on my website, links are in the video description below, but today I’m going to take it a step further and build a 15 meter Moxon.
As a side note, if you are looking to build a Moxon antenna for 10, 12 or 17 meters, this tutorial will be helpful in that regard and you can adapt the wire lengths and support methods for those bands.
The inspiration for this antenna build came from an article in the May 2003 issue of QST Magazine by Allen Baker, KG4JJH titled: The Black Widow- A Portable 15 Meter Beam. The article and full plans are available on his website with a link in the video description. With the plans being 20 years old, I had to make a few modifications to the construction as some of the parts had changed, namely the fiberglass collapsible fishing poles. I’ve also made a large deviation by 3D printing the hub instead of building it out of wood. This makes the project a bit more approachable if you don’t have a wood shop but have access to a 3D printer. All of my 3D printed parts are available on Thingaverse if you want to tackle this project yourself.
Waarom komt in de ronde van PI4NWG op 2 meter, het signaal van Bert PA1B, als enige, niet SPETTEREND binnen bij de rondeleider Rob PA1X ?
Rob PE1CHL opperde dat het wellicht lag aan obstakels in het radiopad.
Hoe loopt het radiopad? En wat zou er tussen staan?
Ik open: Find your Locator van K7FRY: https://k7fry.com/grid/
Door te klikken op de beide QTH's, geeft het programma het pad tussen de beide stations, met een groene lijn aan. Om een goede resolutie te behouden heb ik een drietal schermafbeeldingen in Paint aan elkaar geplakt.
Bekijk eerst het plaatje zonder in te zoomen. Links boven zie je het QTH van Rob en helemaal rechtsonder zie je het QTH van Bert.Tussen Bert PA1B en Rob PA1X bevinden zich 4 gebouwen, die precies in het radiopad staan. Deze gebouwen heb ik in het geel aangegeven.
Vanuit de locatie van Bert PA1B, helemaal rechts onder in de afbeelding, wordt het directe signaal geblokkeerd door:
1 Flat bij het Makadocentrum (5 verdiepingen)
2 De Dichter aan de Richterslaan
Het rode bolletje onder het cijfer 3, is het midden van het radiopad.
Dit is dus het LAAGSTE punt van het radiopad.
3 Gebouw Soevereinburg aan de Soevereinburg
4 De flat boven de Fietsliefhebber aan de Batauweg/Penningburg
Dus de signalen tussen Bert en Rob zijn reflecties.
.
Om in te zoomen, klik je met de rechter muisknop op de afbeelding en kiest voor: Link openen in nieuw tabblad.
Er staan 4 gebouwen in het radiopad tussen PA1X boven en PA1B beneden
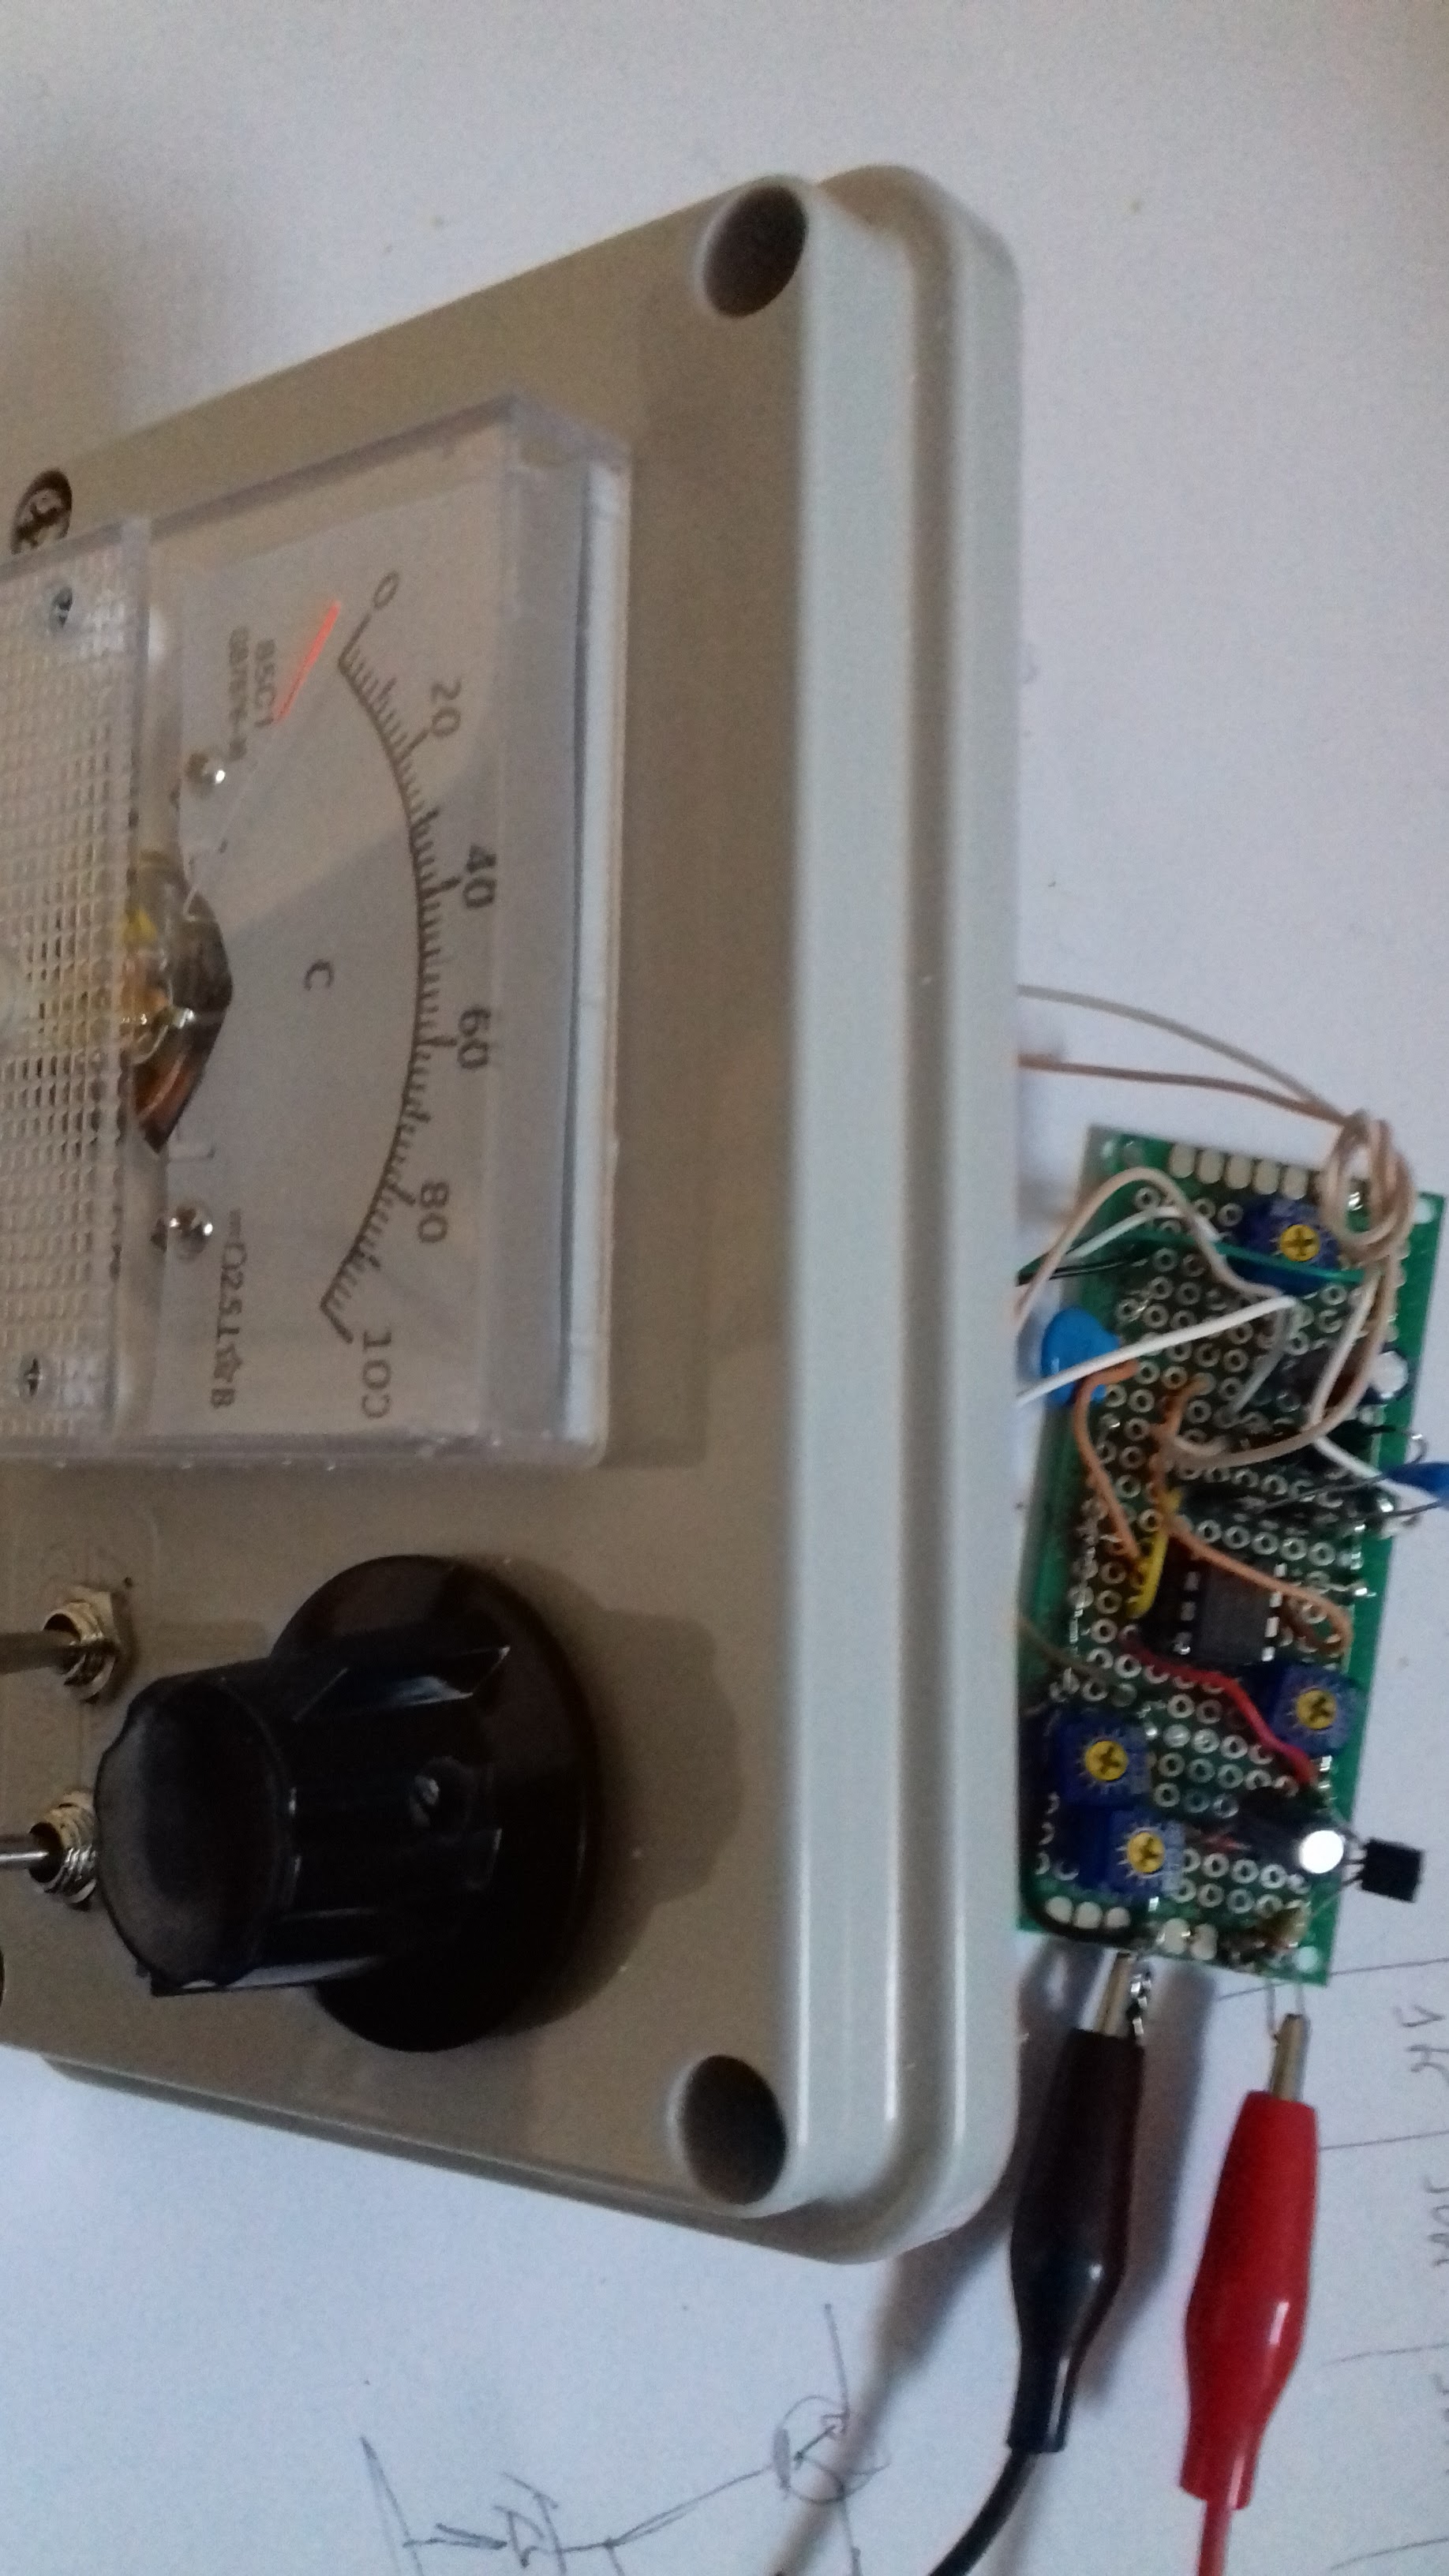
One youtube video by VK3YE was enough to get me started building, after all, the meter that I was using before was not behaving correctly (latter found the problem).
The outcome was this:
(scale on the left switch is wrongly printed, where is x2 should be x0.5/divide by 2)
During build:
Making the scale:
The scale on the meter was changed from the original 0-50 to 0-100, the easiest way was to scan the original face-place and then edit on a image editor.
To calibrate I used a 68pF and 27pF capacitor, the idea was not to have highest precision possible only to be in a position of having certain about unmarked capacitors.
I used different Ge diodes and the 10K pot was changed for 2 of 5K in series to give better adjustment range. The Zener was changed to 6.8v. Ranges like this:
If one owns a receiver with a waterfall display, the increased cluttering of the 12 and 10 meter bands with weird "swooping" signals could not have gone unnoticed. Take, for example, this recent snapshot of the lower portion of 10 meters from the waterfall of WebSDR #5 at the Northern Utah WebSDR (Link)
Figure 1: 10 Meters as seen on a beam antenna pointed toward Asia showing QRM from a large number of different sources - presumably dielectric heaters/welders/seamers. These things radiate badly enough that they should have their own callsigns, right? Click on the image for a larger version.
In looking at this spectral plot - which comes from an antenna oriented to the Northwest (toward Asia and the Pacific) one could be forgiven for presuming that someone had somehow connected a can of "Silly String" to their coax and was squirting noodles into the ionosphere!
What, specifically, are we looking at?
Across the entire spectrum plot one can see these "curved" signals, some of them - like that near the bottom, just above the cursor at 28374 kHz - are quite strong while there are many, many others that are much weaker, cluttering the background. These signals contrast with normal SSB and CW signals - the former being seen clustered around 28500 and the latter around 28100 kHz - which are more or less straight lines as these represent transmissions with stable frequencies.
What are these from? The general consensus is that these are from "ISM" (Industrial, Scientific and Medial) devices that nominally operate around 26957 kHz to 27283 kHz. Clearly, the waterfall plot shows many devices outside this frequency range.
What sort of devices are these? Typically they are used for RF heating - most often for dielectric sealers of plastic items such as bags, blister packs - but they could also be used in the manufacture of items that require some sort of energetic plasma (e.g. sputtering metal, etching) in any number of industrial processes.
Where are they coming from?
The simple answer is "everywhere" - but in terms of sheer number of devices, it's more likely that much of the clutter on these bands originates in Asia. Consider the above spectral plot from an antenna located in Utah pointed at Asia - but then consider the plot below, taken at about the same time from an antenna that is pointed east, across the continental U.S. and Canada - WebSDR #4 at the Northern Utah WebSDR (link):
Figure 2: 10 Meters on a beam pointed toward the U.S. Click on the image for a larger version.
To be absolutely fair, this was taken as the 10 meter band was starting to close across the U.S, but it shows the very dramatic difference between the two antenna's directionality, hinting at a geographical locus for many of these signals.
Further proof of the overseas origin of these signals can be seen in the following plot:
Figure 3: Spectrum from AM demodulation of some of the signals of Figure 1 showing 50/100 Hz mains energy. Click on the image for a larger version.
This plot was taken by setting the WebSDR to AM and setting for maximum bandwidth, tuning onto a frequency where several of these "swoops" seen in Figures 1 and 2 are recurring and then, using a virtual audio cable, feeding the result directly into the "Spectran" program (link).
As expected this plot shows a bit of energy at the mains harmonic frequencies of 120, 240 and 360 Hz owing to the fact that this antenna points into slightly-noisy power lines operating at the North American 60 Hz frequency - but on this plot you can also see energy at 50 and 100 Hz, indicative of a lightly-filtered power supply operating from 50 Hz power mains - something that is NOT present anywhere in North America.
Based on other reports (IARU "Intruder Watch", etc.) a lot of these devices seem to be located in Asia - namely China and surrounding countries where one is more likely to experience lax enforcement of spurious radiation of equipment that is manufactured/sold in those locales.
Why the "swoop", "curve" or "fishook" appearance seen in Figure 1? If these devices were crystal controlled and confined to the nominal 26957 kHz to 27283 kHz ISM frequency range, we probably wouldn't see them in the 10 meter amateur band at all, but many of these devices - likely "built to cost" simply use free-running L/C oscillators that are accurate to within 10-15% or so: As these oscillators - which are likely integral to the power amplifier itself (perhaps self-excited) - warm up, and as the industrial processes itself proceeds (e.g. plastic melts, material cures, glue dries) the loading on the RF output of this device will certainly change, and this results in an unstable frequency.
Why do they radiate?
Ideally, the RF would be contained to the working area and in the past, reputable manufacturers of such equipment would employ shielding of the equipment and filtering of power and control leads to confine the RF within. But again, such equipment is often "built to cost" and such filtering and shielding - which is not necessary for the device to merely function is often omitted.
Can we find and fix these?
In this U.S. and parts of Europe such sources are occasionally tracked down and RF interference mitigated - either voluntarily or with "help" from the local regulator - but the simple fact is that the intermittent nature of these sources - and the fact that they radiate on frequencies that are prone to good propagation when the sun is favorable to such - makes them very difficult to localize. If the signal source is coming from halfway around the world, there's likely nothing that you can do other than point your directional antenna the other way!
If it so-happens that you can hear such a signal at your location at all times of the day - regardless of propagation - you may be in luck: There may be a device with a short distance (a few miles/km) of your location - and perhaps you can make a visit and help them solve the problem.
Small project made last year (4 days ago) just for fun and to try out the SWR feature of the spectrum analyzer.
Design is based on this one to the exception of the ferrite material, I used 43 instead of 77.
RF source will be the tracking generator, load will be device under test and detector the spectrum analyzer RF input.
For the 50 Ohm resistors (R1,R2,R3) I used two leaded 100 Ohm in parallel, SMD and shorter leads between components would help more on the high frequency side of the spectrum.
Build:
Some data taken:
With no load connected in one direction and then the opposite one (cable swap), if all is perfectly balanced it should show equal lines, in this case....almost there, in any case the return loss line is all but flat...
Now measuring a 50 Ohm load, ideally should give the lowest possible result and a flat line for all the frequency range:
At 1.6Mhz: 1.22, so not very usable at the low range, probably due to lack of inductance on the core.
At 10.8 Mhz, 1.05, much more inline with and expected result (very low VSWR).
At 152 Mhz looks like it starts to break the measurement again.
And forget it at 433 Mhz since it's too off.
The load used was a Narda 370 BNM, 5W and good to 18Ghz.
Basically it's very usable on the HF range or just as general curve tracer for antenna VSWR at VHF frequency ranges.
You can also take the same info without the SWR measurement option on the Spectrum Analyzer, just use the tracking generator, normalize in the open position (no device under testing connected) and then look for the SWR from the return loss measured, you can use this table or calculate it yourself.