The best dollar you can spend on a child’s STEAM education is to take them to the dollar store, buy an electronic item, and then take it apart. Learning how a handheld fan, LED light, remote control, or headphones work will help show how wind turbines, traffic lights, speakers, keyboards, and other modern devices function.
The next step is to take apart a dollar store item and make it better — combine two items, replace a switch, create something new and unique. Scrappy Circuits is the perfect way to get started.
I first developed Scrappy Circuits with Chris Connors and Eva Luna while working at Xraise, an education outreach program at Cornell University. What began as an exploration of DIY switches ended later as a self-made invention system sourced from a fifty-cent LED tea light. Educators can build it with their class for about $20. Anyone with access to office supplies and a dollar store can make the five Core Bricks for about $1. Here’s how to create each one.
Many college students participate in sports, listen to music, or play video games in their spare time, but IEEE Student Member Gerard Piccini prefers amateur radio, also known as ham radio. He’s been involved with the two-way radio communication, which uses designated frequencies, since his uncle introduced him to it when he was a youngster. His call sign is KD2ZHK.
Practically everything you use in your everyday life works because of measurement science. Without precise measurements, your car wouldn’t run, your phone wouldn’t work, hospitals couldn’t function, and the ATM would fail.
NIST is the national measurement institute of the United States. Most people in the U.S. have no idea that there is a single organization within the federal government that makes sure all measurements in the U.S. are correct and trustworthy — and that they are accepted by other governments worldwide.
Most circuit designers probably aren’t thinking about, much less worrying about, the metal copper. But as the electrification of the world continues, copper conductors used in applications from microchips, other components and circuit boards, to household, industrial, and automotive wiring, and critical workhorses like batteries and electric motors, points to the need to spotlight its starring role.
At an hour and a half, this video is kind of long, but if you’re interested in propagation, it’s worth watching.
W2AEW on how to use a NanoVNA to measure a filter’s characteristics
Alan, W2AEW, shows how to use a NanoVNA, which is one of the most useful tools for characterizing RF components and circuits.
Hallicrafters World of SW Radio
Back in the day, Hallicrafters was arguably the biggest name in amateur and shortwave radio. Unfortunately, this is just an audio file, but I guess, radio is audio so just close your eyes and imagine that you’re listening to this on a Hallicrafters receiver.
Tuesday, my friend Paul, KW1L, texted me, and asked if I could come over to his house and help him with his new antenna. He had just purchased and installed a Cobra Ultra-Lite Junior, and he didn’t think that it was performing as well as it should.
The suspect jumper wire.
I won’t go into all of the details, but one of the checks he had made was to measure the continuity of the feed line, which is 80 feet of 18-gauge, 450 Ω ladder line. To do this, he connected the jumper wire in the photo at right across the ladder line in his shack and then measured the resistance at the antenna feed point.
The measurement that he came up with was 16 Ω. Well, the National Institute of Science and Technology (NIST) says that the resistance of 18-gauge solid wire should be about .0064 Ω/ft. Using that figure, the resistance should be somewhere near 1 Ω.
So, Paul asked me to bring over my DMM, which I did yesterday. We dropped the antenna, put my Fluke 79 across the feed point, and measured close to 16 Ω.
It didn’t make much sense, but the only reasonable explanation was that the problem with this measurement was the jumper wire. This was somewhat troubling to Paul, as he had a sentimental attachment to this jumper wire. It was given to him by a fellow who worked for him at Xerox, and he pointed out to me how well-made it was. He noted, for example, that each end of the wire had been tinned before it was screwed to the alligator clip.
I agreed that it was well-made, but certainly one or both of the connections could have oxidized, resulting in a high-resistance connection. And guess what? When I measured the resistance of the jumper, it turned out to be about 15 Ω!
I then unscrewed the wire at one end and measured again. It measured 15 Ω. I unscrewed the wire at the other end, and voilá, I measured 0 Ω. I screwed the alligator clips back on, and the overall resistance was near 0 Ω again. My guess is that the second connection was a little loose, and that over the years, some oxidation built up on both the wire and the alligator clip.
Whenever we do something like this, Paul likes to ask, “So, what did we learn from this?” In this case, I think what we learned is that even jumper wires can go bad. It’s also a validation of the KB6NU Theory of Electronic Failures, i.e. at least 80% of the problems associated with electronic equipment are problems with cables or connectors.
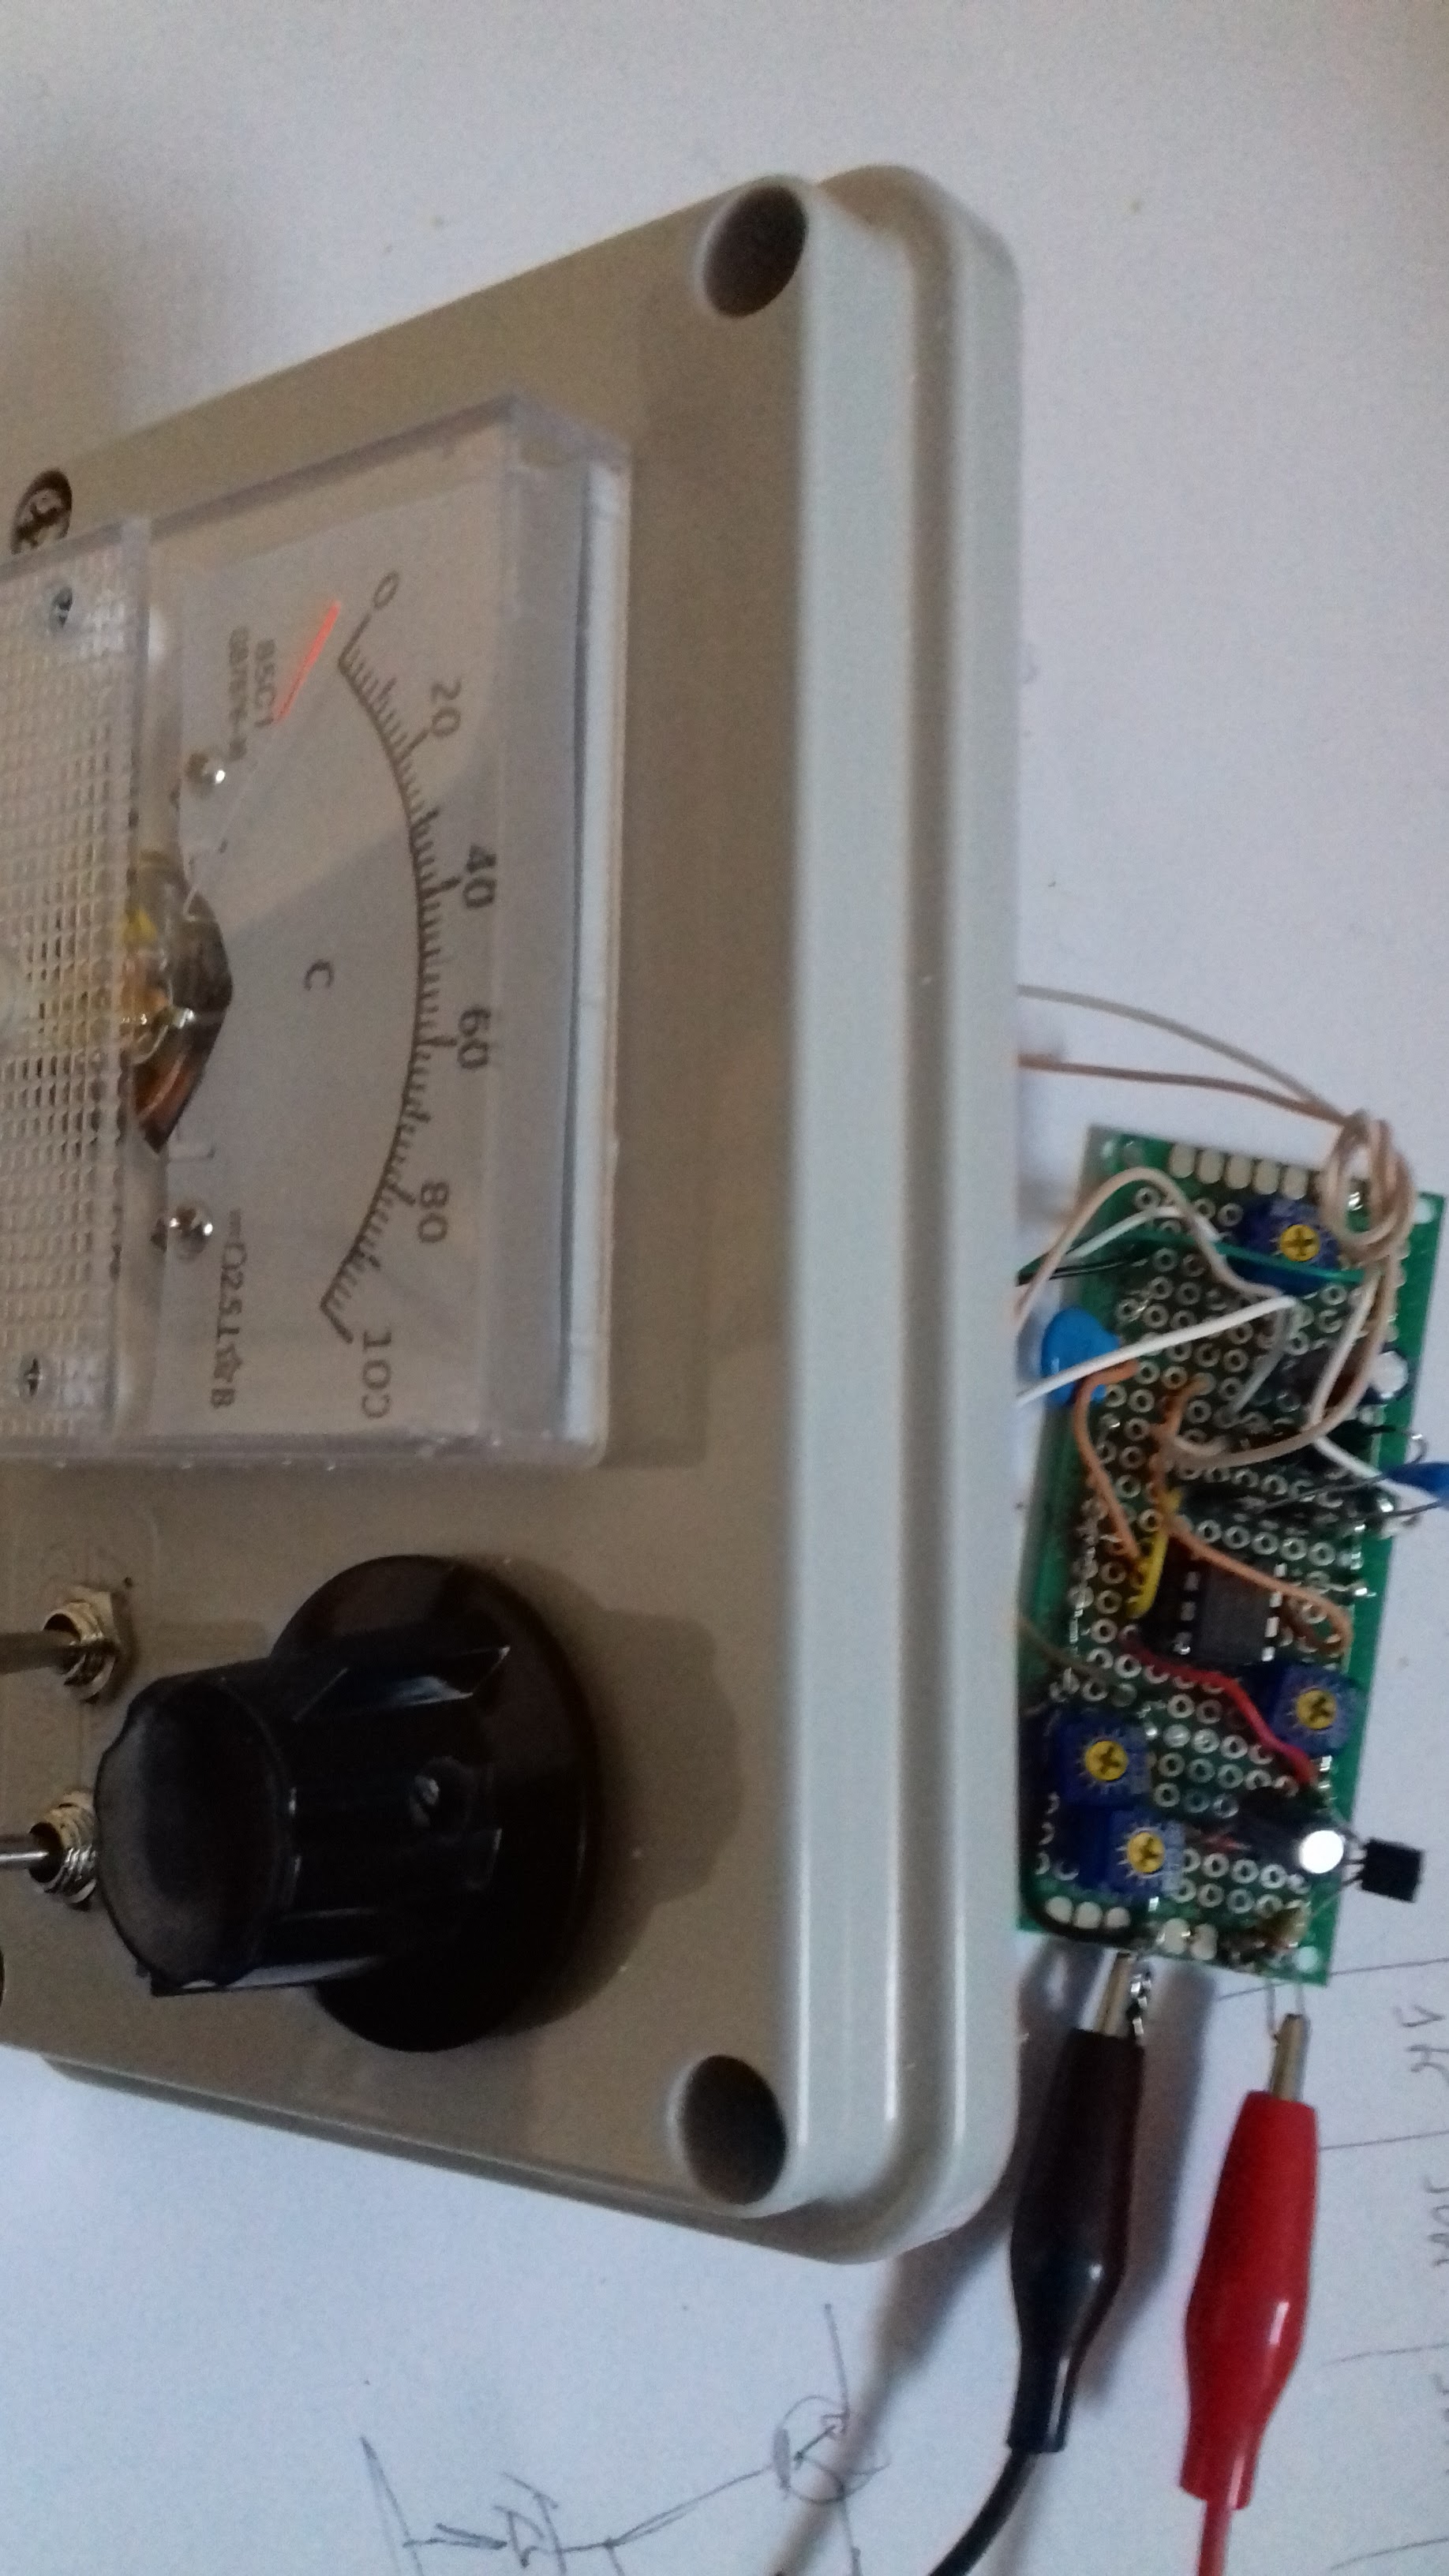
Only added provision for self "TEST", that is; the switch disconnects the terminals and connect internally to know resistor values via rotary switch (minimum 2 Ohm since had nothing smaller at the time). Also add zeroing via a pot on R24 place.
One youtube video by VK3YE was enough to get me started building, after all, the meter that I was using before was not behaving correctly (latter found the problem).
The outcome was this:
(scale on the left switch is wrongly printed, where is x2 should be x0.5/divide by 2)
During build:
Making the scale:
The scale on the meter was changed from the original 0-50 to 0-100, the easiest way was to scan the original face-place and then edit on a image editor.
To calibrate I used a 68pF and 27pF capacitor, the idea was not to have highest precision possible only to be in a position of having certain about unmarked capacitors.
I used different Ge diodes and the 10K pot was changed for 2 of 5K in series to give better adjustment range. The Zener was changed to 6.8v. Ranges like this:
Had this build for some time, now it's time to show.
I was doing some experiments on the 10Ghz band and wanted a way of looking at the signals. Because the spectrum analyser I have only good to 1.5Ghz had to find a cheap way of doing it to get this:
Here looking at the third harmonic from an ADF4351 on 3.3Ghz after a pipe cap 10Ghz filter experiment.
The diagram explanation: a dbm mixer (Watkins-Johnson M80LCA) with a local oscillator based on a FVC99 10Ghz oscillator module (cheapest VCO I could find for 10Ghz). Some preamps on the input and output using 2Ghz preamp modules and replacing the MMIC amplifiers for the ones like Corvo NLB300 or ERA-1 that are good to 10Ghz.
The basic design:
To this diagram I added a 6db directional coupler inline with the FVC99 VCO (used a Omni Spectra PN2023, good from 8 12.4Ghz) so I could measure the LO frequency and PLL it.
There is no stability control on the FVC99 oscillator, still working on a PLL system (maybe one of these days) but in my case I have two select positions, one: VCO is controlled by a single pot (like on the diagram) and the other position controlled by an EIP371 frequency counter (from the Lo Out via directional coupler) that makes the PLL loop. With EIP371 and since the output voltage of the loop is very small the control range seats near 9.5Ghz, there is an option of extending the range like on the EIP manual:
Or with a similar diagram, a multiply by 10 of the PLL voltage out of the EIP371, that would be enough to use the full range of the FVC99.
For now I use 9.5 Ghz if using the EIP371 for more stability and around 10Ghz set by the pot ("Flo" on the panel) if it's just a quick test.
Here the EIP working as external PLL controling the FVC99 so the LO gets more stable.
On the Rigol DSA815 spectrum analyser you can set the input offset to get the display right on the band of interest
Displaying here a 10Ghz signal using the 9.5Ghz Lo frequency
If you want to just check if the signal is around there, no need to use external PLL control to the FVC99, the "stability" with a simple potentiomenter is enough.
Inside view:
The VCO adjust pot (top right in blue) is glued directly to the front panel
Some other images during prototype development:
Here one of the firsts tests, just an input amplifier, the mixer, the VCO and VCO amplifier and the mixer IF output directly to the spectrum analyser.
Testing during early days of the prototype with a 10Ghz homemade flange to SMA adapter and a pipe cap filter:
Anyhow, not a measuring device but it serves the purpose of checking if you have any signal around the 10Ghz band and for experiments, still very happy with the outcome and sensitivity.
Nothing major here, needed a small signal generator to test in the 10Ghz range (using harmonics from 3.3Ghz), decided to go with the ADF4351 module available everywhere. This is an improvement over the previous iteration here.
After the initial testing on 3.3Ghz made some changes on the software in order to set some common frequencies for future testing with QO-100 satellite equipment and also added provision to sweep around the frequency currently set in order to test some filters.
Output on 3.4Ghz:
And testing the third harmonic:
The Rigol is not a 10Ghz version, I'm using a down converter before the input, that will be another post...
The diagram, at this stage I still didn't added the two extra buttons (look on code for mode and band), to change band and to change mode between set frequency and sweep.
Inside on the almost final interaction (waiting SMA's to connect to front pannel):
And the front panel view working:
The code on the current version, keep in mind might still have some bugs, reach me for latest version if there is one:
If blogger breaks formatting ask me a copy by email.
/*! ADF4351 signal generator
CT2GQV 2020 v1.4
Based on code from: ADF4351 example program https://github.com/dfannin/adf4351
VFO with 100Khz steps starting from a predifined frquency (UL frequencia) using 2 buttons for up and down. Display on 16x2 I2C LCD of the frequency set and the third harmonic value Also serial output of the main frequency set. Possibility to sweep for filter testing. */
vfo.ChanStep = steps[4] ; ///< change to 100 kHz }
void loop() { int buttonState0 = analogRead(button0); // mode int buttonState3 = analogRead(button3); // band
int buttonState1 = analogRead(button1); // up int buttonState2 = analogRead(button2); // down // serial debug for the button for +/- frequency // Serial.print("B1,B2:"); Serial.print(buttonState1); Serial.print(","); Serial.println(buttonState2);
// band / start/stop sweep // button pin is puled down to ground...or close to it (100) as long as lower than 2049 if (buttonState3 <= 100) { {
if (opmode == 1 ){ /////// start stop start procedure if(tempopmode == 1) // started { lcd.clear(); lcd.setCursor(0, 0); lcd.print("SWEEPING starded "); lcd.setCursor(0, 1); lcd.print("Stop----------> "); tempopmode = 255; maxfrequencia=frequencia+10000000; //compute the max frequency so we start from the one now and 100Mhz down and up minfrequencia=frequencia-10000000; //compute the min frequency so we start from the one now and 100Mhz down and up delay(150); } else // is stoped { lcd.clear(); lcd.setCursor(0, 0); lcd.print("SWEEPING stoped "); lcd.setCursor(0, 1); lcd.print("Start---------->"); tempopmode = 1; delay(150); } };
// we are in band mode if (opmode == 0 ){ Serial.print ("BAND: "); band++; if (band > 4){band=0;}; if(band == 0){ frequencia=3496500000UL; vfo.setf(frequencia); lcd.clear(); lcd.setCursor(0, 0); lcd.print("F :"); lcd.print(frequencia/1000); lcd.setCursor(0, 1); lcd.print("F(3):"); lcd.print((frequencia/1000)*3); };
// if we are sweeping if (opmode==1 && tempopmode == 255){lcd.print(" .");}; if (opmode==1 && tempopmode == 255){lcd.print(" o");}; if (opmode==1 && tempopmode == 255){lcd.print(" O");};
if (opmode==1 && tempopmode == 255){ frequencia += vfo.ChanStep; // increase frquency by step if (frequencia >= maxfrequencia){frequencia=minfrequencia;}; // if we are on the limit then go to lower value vfo.setf(frequencia); Serial.print ("F:"); Serial.println(frequencia) ; };
// up frequency // button pin is puled down to ground...or close to it (100) as long as lower than 2049 if (buttonState1 <= 100) { frequencia += vfo.ChanStep; if ( vfo.setf(frequencia) == 0 ) { Serial.print ("VFO.SET: "); Serial.println(vfo.cfreq) ; lcd.clear(); lcd.setCursor(0, 0); lcd.print("F :"); lcd.print(frequencia/1000); if (band == 0 ){lcd.setCursor(0, 1); lcd.print("F(3):"); lcd.print((frequencia/1000)*3);}; } } // end up frequency
// down frequency if (buttonState2 <= 100) { frequencia -= vfo.ChanStep; if ( vfo.setf(frequencia) == 0 ) { Serial.print ("VFO.SET: "); Serial.println(vfo.cfreq) ; lcd.clear(); lcd.setCursor(0, 0); lcd.print("F :"); lcd.print(frequencia/1000); if (band == 0 ){lcd.setCursor(0, 1); lcd.print("F(3):"); lcd.print((frequencia/1000)*3);}; } } // end down frequency
// button software debounce if we are not sweeping if (opmode == 0) { delay(150); };
Not much here, just a simple signal generator based on ADF4351 module from "fleebay". PS: there is an improvement over this code at this new post.
I just needed to generate one single frequency that can go up or down in 100Khz steps via two push buttons. Added an optional LCD to display the main frequency and the third harmonic since I'm using it to verify some equipment on 10Ghz.
Test board:
On the frequency counter:
Schematic based on an Arduino Nano controler:
Spectrum output on lower frequencies (414Mhz) and output level at "0" (add 20db attenuation at the spectrum input):
and the third harmonic:
Power at "3" (second harmonic now visible)
3rd harmonic as seen on a 10Ghz adapter for a 1.5Ghz spectrum analyzer: (not calibrated):
Code:
/// code start /*! ADF4351 signal generator
CT2GQV 2020 v1.3
Based on code from: ADF4351 example program https://github.com/dfannin/adf4351
VFO with 100Khz steps starting from a predifined frquency (UL frequencia) using 2 buttons for up and down. Display on 16x2 I2C LCD of the frequency set and the third harmonic value Also serial output of the main frequency set. */
// buttons for up/down in frequency, puleed up from 5v with a 10K resistor, analog pin will be short to ground for button press int button1 = 1; int button2 = 2;
vfo.ChanStep = steps[4] ; ///< change to 100 kHz }
void loop() { int buttonState1 = analogRead(button1); int buttonState2 = analogRead(button2); // serial debug for the button for +/- frequency // Serial.print("B1,B2:"); Serial.print(buttonState1); Serial.print(","); Serial.println(buttonState2);
// up frequency // button pin is puled down to ground...or close to it (100) as long as lower than 2049 if (buttonState1 <= 100) { frequencia += vfo.ChanStep; if ( vfo.setf(frequencia) == 0 ) { Serial.print ("VFO.SET: "); Serial.println(vfo.cfreq) ; lcd.setCursor(0, 0); lcd.print("F :"); lcd.print(frequencia/1000); lcd.setCursor(0, 1); lcd.print("F(3):"); lcd.print((frequencia/1000)*3); } } // end up frequency
// down frequency if (buttonState2 <= 100) { frequencia -= vfo.ChanStep; if ( vfo.setf(frequencia) == 0 ) { Serial.print ("VFO.SET: "); Serial.println(vfo.cfreq) ; lcd.setCursor(0, 0); lcd.print("F :"); lcd.print(frequencia/1000); lcd.setCursor(0, 1); lcd.print("F(3):"); lcd.print((frequencia/1000)*3); } } // end down frequency
// button software debounce delay(150); } /// code end
Some other signal generators based on similar modules and also the ADF4355: http://f6kbf.free.fr/html/ADF4351%20and%20Arduino_Fr_Gb.htm https://pa0rwe.nl/?page_id=1345 (for the ADF4355)